
Key Takeaways
- Realistic luxury hotel financial projections for a DPR must be built from operating assumptions – rooms, occupancy ramp-up, ARR, F&B covers, banquet events, cost structure – rather than applying flat annual growth rates. Luxury hotels require a nuanced approach for financial projections because revenue depends on multiple interacting variables.
- Every projection must connect logically: assumptions → revenue → operating expenses → EBITDA → depreciation and interest → profit → cash flow → loan repayment → DSCR → project viability. This is precisely how Indian banks appraise 4-star and 5-star hotel proposals.
- This article is written from the perspective of CA Manish Gugliya (ProjectReportBank.com), who prepares DPRs, CMA data and hotel project finance proposals, and walks through a complete example for an Indian 120-room five star hotel.
- You will see concrete Indian-style examples: realistic 2026–27 ARR and occupancy levels, a sample term-loan structure, projected P&L, cash flow statement, projected balance sheet and DSCR calculation, plus sensitivity and scenario analysis.
- Strong profits alone do not guarantee loan repayment. Lenders focus on DSCR, repayment capacity, working capital and robustness of assumptions. Treat the hotel financial model as an integrated tool, not a set of disconnected spreadsheets.
Explore Luxury / 4-Star & 5-Star Hotel Project Report Guides
Explore our complete Luxury, 4-Star and 5-Star Hotel Project Report and DPR guides covering setup cost, equipment, project cost, revenue, financial projections, occupancy, feasibility, project finance and bank loan assessment.
Introduction: Why Financial Projections Are the Heart of a Luxury Hotel DPR
For a 4-star or 5-star luxury hotel in India, financial projections are one of the most scrutinised sections of the detailed project report. The hospitality industry is capital-intensive, and a single project can involve development cost running into hundreds of crores. The global hotel industry was valued at approximately $1.21 trillion in 2023, and India’s hospitality sector continues to attract significant hotel investment – but every rupee of that investment must be justified through credible financial data.
Hotel development costs include land, civil construction, interiors and pre-opening expenses that can easily reach INR 150–350 crore for a 120–200 room five star hotel. This creates large term-loan obligations that must be serviced entirely from the hotel’s cash flow. Revenue generation depends on occupancy rate, ARR/ADR, seasonality, ramp-up period, the strength of food and beverage operations, banquet and wedding business, and whether the property is an independent hotel or operates under branded hotel management.
Bankable luxury hotel financial projections for DPR cannot be built by applying “10% growth every year.” They must emerge from capacity-driven assumptions and a clear luxury hotel revenue model that accounts for rooms, F&B, banquet and other hotel income streams.
Throughout this article, we follow the central chain: Operating Assumptions → Hotel Revenue Projections → Operating Expenses → GOP and EBITDA → Depreciation and Interest → Profit → Cash Flow → Projected Balance Sheet → DSCR and Repayment Capacity → Financial Viability.
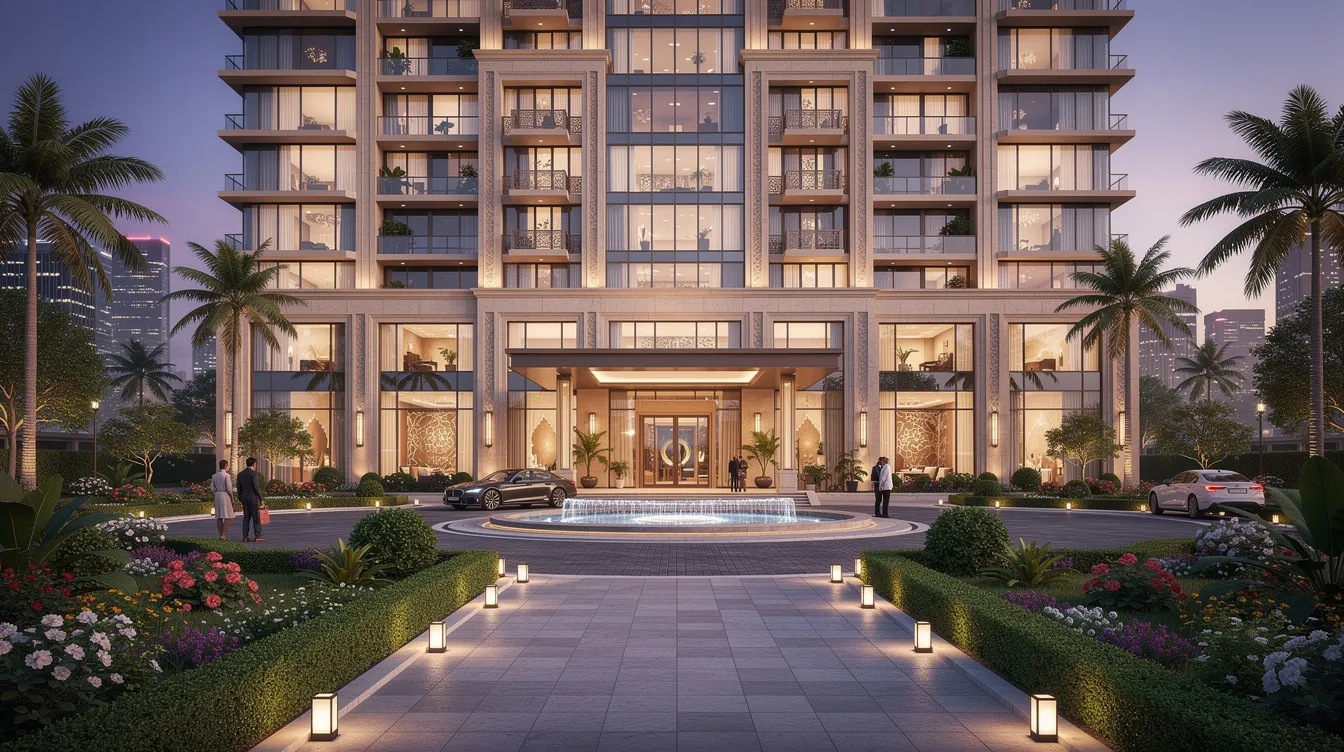
Understanding Luxury Hotel Financial Projections in a DPR
Luxury hotel financial projections for DPR are typically 5–10 year forecasts of the projected profit and loss statement, cash flow statement and balance sheet, prepared to support project finance, term loans and investor decisions. A robust hotel model typically covers a 10-year forecast period, though this depends on debt tenure and lender expectations.
The logic is straightforward: operating assumptions (rooms, occupancy, ARR, F&B covers, banquet events) feed room revenue and other income, which drive hotel operating expenses, EBITDA, depreciation, interest, net income and ultimately debt service ability. Hotel financial statements are essential for managing operations and demonstrating the hotel’s financial health to lenders. Financial statements help assess a hotel’s risk and repayment capacity – which is why banks look beyond profit after tax.
Consider a simple illustration: a hotel projects PAT of INR 8 crore in Year 3, but annual debt service (interest plus principal) is INR 22 crore. Unless depreciation and other non-cash charges add sufficient cash accrual, the hotel cannot meet its obligations despite showing accounting profit. A hotel financial model integrates operational and financial assumptions so that changing occupancy, ARR or loan terms automatically updates revenue, profit, cash flow, balance sheet and DSCR – avoiding the inconsistencies frequently seen in weak hotel project reports.
Key Operating & Financial Assumptions Before Building the Model
In bankable hotel DPRs, the assumptions page is one of the first things credit officers read. Every number must have a commercial justification – market analysis, brand input, historical data or comparable hotel performance.
A good luxury-hotel projection starts with market demand and competitive set analysis. Key components include occupancy, ADR, and operating expenses. The assumption blocks to document include:
- Room inventory: number of rooms/keys, room categories (standard, deluxe, suite), available room nights per year
- Occupancy ramp-up: Year 1 at 45%, gradually rising to 68–70% by Year 5, reflecting the reality that luxury properties require an extended stabilization period to build brand equity
- ARR/ADR: by room type and year, benchmarked against competitors in the micro-market
- F&B and banquets: restaurant seat count, average covers per day, average spend per cover, banquet halls and lawns, expected events per month, average billing per event
- Employee cost: department-wise strength, average salary levels, annual escalation
- Utilities: power, water, fuel consumption estimates
- Capital structure: total project cost, term loan amount, promoter equity, debt–equity ratio, interest rate, moratorium, repayment tenure and working capital requirement
Each assumption – whether 65% stabilised occupancy or INR 8,000 ARR for a Tier-1 city – should be backed by market comparables. Readers seeking detailed benchmarking methods can refer to the guide on luxury hotel occupancy, ARR, RevPAR and break-even analysis, and the luxury hotel project cost and means of finance article for capital-cost detail.
Illustrative Example: 5-Star Luxury Hotel Project in India (Assumptions)
All subsequent numerical illustrations use one consistent, clearly labelled example: a hypothetical 120-room urban five star hotel in a Tier-1 Indian city, opening in FY 2027–28. Starting a hotel of this calibre can cost from hundreds of thousands to millions of dollars equivalent. All figures below are illustrative only – actual values vary significantly by location, positioning, and management model.
| Parameter | Assumption |
|---|---|
| Total Rooms | 120 (80 Standard, 30 Deluxe, 10 Suite) |
| Operating Days | 365 per year |
| Available Room Nights | 43,800 per year |
| Occupancy Ramp-up | Yr 1: 45%, Yr 2: 55%, Yr 3: 60%, Yr 4: 65%, Yr 5: 68% |
| ARR (Year 1) | ₹7,000, escalating 4–5% annually |
| F&B Revenue | ~60–70% of room revenue (stabilised) |
| Banquet/Events Revenue | ~20–25% of total revenue |
| Total Project Cost | ₹260 crore |
| Term Loan | ₹160 crore (debt–equity ratio ~1.6:1) |
| Promoter Equity | ₹100 crore |
| Interest Rate | 10.50% p.a. (floating) |
| Moratorium on Principal | 2 years post COD |
| Repayment Tenure | 10 years |
Operating cost ratios: payroll at 25–28% of total revenue, power and fuel at 9–10%, F&B consumption at 32–35% of F&B revenue, sales and marketing at 4–6%, repairs and maintenance at 3–4% of total revenue, admin and general at 6–8%.
Room Revenue Projection: Occupancy, ARR and Mathematical Formulas
Room revenue is the largest and most stable revenue stream in a luxury hotel business. It must be projected bottom-up using the hotel’s room inventory and market-driven assumptions. The Occupancy Rate is calculated as Rooms Sold divided by Rooms Available.
The formulas are:
- Available Room Nights = Number of Rooms × 365
- Occupied Room Nights = Available Room Nights × Occupancy %
- Room Revenue = Occupied Room Nights × ARR (ADR)
| Parameter | Year 1 | Year 3 |
|---|---|---|
| Available Room Nights | 43,800 | 43,800 |
| Occupancy | 45% | 60% |
| Occupied Room Nights | 19,710 | 26,280 |
| ARR (₹) | 7,000 | 7,644 |
| Total Room Revenue (₹ Cr) | 13.80 | 20.09 |
Notice how a 15-percentage-point increase in occupancy combined with modest ARR growth lifts room revenue by over 45%. This is operating leverage at work.
Assuming 75–80% occupancy from the first year will undermine credibility with banks. Luxury hotels often forecast occupancy using historical data and seasonality patterns, and Indian branded hotels in Tier-1 cities averaged about 75% occupancy at stabilised levels, not from day one.
ARR / ADR Assumptions and RevPAR Analysis
ADR is the average revenue earned per occupied room per night. In hotel financial projections, ARR should be derived by benchmarking against competitor four star and five star hotels, understanding the business travel vs leisure mix and factoring in introductory discounts during the initial years. Luxury hotels typically focus on maximizing ADR over high occupancy, as discounting deeply to fill rooms erodes brand positioning.
RevPAR (Revenue per Available Room) combines room revenue and occupancy into a single metric. RevPAR equals room revenue divided by available rooms, or equivalently, ARR × Occupancy Rate. Current industry forecasts predict strong growth for U.S. luxury RevPAR, and Indian markets are similarly buoyant in Tier-1 cities.
| Year | ARR (₹) | Occupancy | RevPAR (₹) |
|---|---|---|---|
| Year 1 | 7,000 | 45% | 3,150 |
| Year 3 | 7,644 | 60% | 4,586 |
| Year 5 | 8,232 | 68% | 5,598 |
RevPAR is a key KPI in luxury hotel performance evaluation because it captures both pricing power and demand simultaneously. A hotel with high ARR but low occupancy may generate the same RevPAR as one with moderate ARR and strong occupancy – but the underlying business dynamics differ entirely.
Revenue Projections Beyond Rooms: F&B, Banquets and Other Income
Luxury hotels in India derive substantial guest revenue from restaurants, bars, banquets, weddings, conferences, spa and ancillary revenue streams. High-end dining and destination bars command significant revenue in luxury hotels, and premium spa treatments yield high profit margins.
The main revenue streams for the illustrative hotel project include: room revenue, restaurant and bar revenue, banquet and events revenue, spa and wellness, laundry, room service, transport and travel desk, and miscellaneous operating income. Luxury hotels also generate ancillary revenue from services like valet and transport. TRevPAR measures total hotel revenue per available room across all departments, offering a more complete picture than RevPAR alone.
| Revenue Stream | Year 1 (₹ Cr) | Year 5 (₹ Cr) | % of Total (Yr 5) |
|---|---|---|---|
| Room Revenue | 13.80 | 24.47 | 48% |
| F&B Revenue | 8.28 | 15.30 | 30% |
| Banquets & Events | 3.31 | 7.14 | 14% |
| Spa, Laundry, Other | 1.38 | 4.08 | 8% |
| Total Revenue | 26.77 | 50.99 | 100% |
A word of caution: many hotel project reports overestimate banquet and F&B income based on a few peak-season weddings. Base assumptions on realistic utilisation of banquet space and actual market demand, not aspirational peak billing. Readers wanting a deeper breakdown of individual revenue lines can refer to the dedicated luxury hotel revenue model guide.
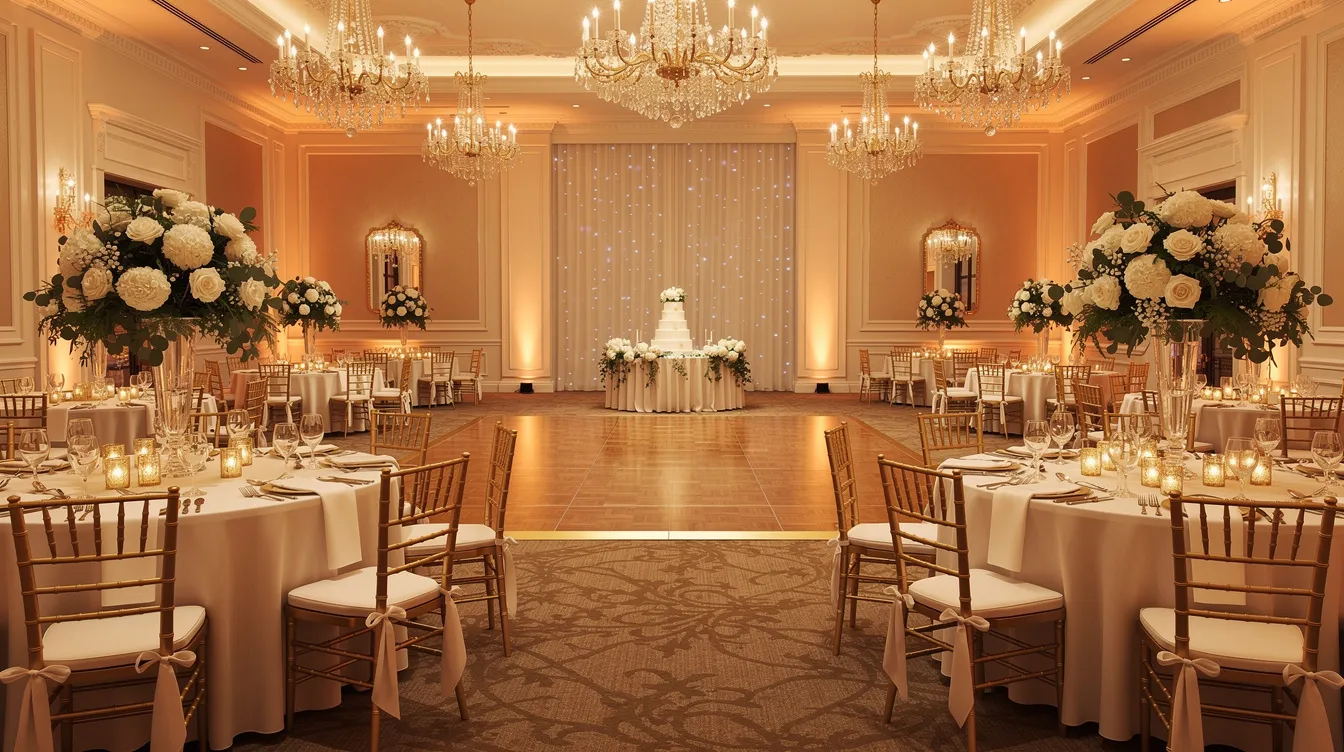
Projected Operating Expenses: Fixed, Semi-Variable and Variable Costs
For luxury hotels, operating expenses are complex and must be grouped by nature and behaviour. Operating margins for large Indian hotel companies are expected around 34–36%, implying total operating costs of 60–70% of total revenue in the stabilised phase.
Major hotel expenses include employee cost (the largest component), F&B consumption, housekeeping and guest supplies, power and fuel, laundry and linen, repairs and maintenance, IT and communication, sales and marketing including OTA commissions, admin and general expenses, insurance, property taxes and management fees where applicable.
Classification matters: many payroll costs are semi-fixed (core staff remains even at low occupancy), utilities are partly variable with occupancy, while insurance and property taxes are largely fixed. Utility costs alone can reach 9–14% of total revenue in luxury Indian hotels, a figure many DPRs underestimate. Undistributed operating expenses such as admin, marketing and property operations add further to the cost base.
| Expense Category | % of Total Revenue (Yr 3) |
|---|---|
| Employee Cost | 26% |
| F&B Consumption | 11% |
| Power & Fuel | 9% |
| Sales & Marketing | 5% |
| Repairs & Maintenance | 4% |
| Admin & General | 7% |
| Other Operating Costs | 6% |
| Total Operating Expenses | 68% |
Cost structure varies based on management model, city vs resort, energy tariffs and state-level taxes. Where hotels operate under branded management, management fees (typically 2–3% base fee on revenue plus 8–12% incentive fee on GOP) must be modelled separately.
Departmental Profit, GOP and EBITDA in Luxury Hotels
Hotels measure operational efficiency through departmental profit (rooms, F&B, spa) and then gross operating profit. GOP = Total Operating Revenue – All Operating Expenses (departmental plus undistributed operating expenses), excluding depreciation, interest and taxes. Gross Operating Profit reflects a hotel’s operating efficiency and its capacity to support management fees, fixed property costs and debt service.
GOPPAR (Gross Operating Profit Per Available Room) measures gross operating profit per available room and shifts the focus from revenue to bottom-line profitability in luxury hotels. NOI is gross operating profit minus fixed charges like property taxes and insurance.
| Line Item | Year 3 (₹ Cr) | % of Revenue |
|---|---|---|
| Total Revenue | 34.20 | 100% |
| Total Operating Expenses | 23.26 | 68% |
| GOP | 10.94 | 32% |
| Management Fee (3% Rev) | 1.03 | 3% |
| EBITDA | 9.91 | 29% |
As occupancy increases from ramp-up to stabilised years, EBITDA margin often improves from roughly 18% in Year 2 to 26–28% by Year 5, driven by operating leverage – fixed costs get spread across higher revenue.
Depreciation, Fixed Assets and Luxury Fit-Outs
Depreciation is a significant non-cash expense in luxury hotels because of heavy investment in building, interiors, furniture, fixtures, kitchen equipment, HVAC, elevators and specialised hotel systems. A detailed asset and cost list is available in the luxury hotel equipment, furniture and FF&E cost guide.
Depreciation is computed asset-wise or block-wise based on useful life: building at 30–60 years, furniture and interiors at 8–10 years, plant and machinery at 15 years, and IT systems at 3–6 years. For the illustrative hotel with gross block of INR 220 crore, annual depreciation might range from INR 8–10 crore in the initial years. While depreciation reduces accounting profit and tax, it does not directly reduce cash flow – a distinction critical for DSCR analysis.
Luxury standards demand refurbishments every 5 to 7 years, meaning capital expenditure does not stop after the initial project. FF&E reserves (typically 3–5% of revenue) should be built into projections for ongoing maintenance of the hotel’s assets.
Interest on Term Loan and Correct Loan-Amortisation Logic
In luxury hotel financial projections, interest expense must be calculated on the reducing balance of the term loan, not on the original sanction amount for all years. This is a common modelling mistake that overstates interest and distorts profitability analysis.
For the illustrative hotel: INR 160 crore term loan drawn during construction, interest during construction capitalised into project cost, 2-year moratorium on principal after COD, then equated principal repayments over 10 years at 10.50% p.a.
| Year | Opening Loan (₹ Cr) | Principal Repayment (₹ Cr) | Interest (₹ Cr) | Closing Loan (₹ Cr) |
|---|---|---|---|---|
| Year 1 (Moratorium) | 160.00 | 0.00 | 16.80 | 160.00 |
| Year 2 (Moratorium) | 160.00 | 0.00 | 16.80 | 160.00 |
| Year 3 | 160.00 | 16.00 | 16.80 | 144.00 |
| Year 4 | 144.00 | 16.00 | 15.12 | 128.00 |
| Year 5 | 128.00 | 16.00 | 13.44 | 112.00 |
Interest rate assumptions should reflect realistic current rates for hotel finance in India, typically 9.5–14% depending on lender and promoter credit profile. Banks may stress-test projections with interest rates 1–2% higher.
Projected Profit & Loss Statement (Hotel P&L)
The projected profit and loss statement shows the luxury hotel’s revenue, operating costs, EBITDA, depreciation, interest, tax and net income for each projected year. The hotel P&L shows departmental performance relative to the budget and forms the core of the hotel project report.
| Line Item (₹ Cr) | Yr 1 | Yr 2 | Yr 3 | Yr 4 | Yr 5 |
|---|---|---|---|---|---|
| Room Revenue | 13.80 | 18.14 | 20.09 | 22.77 | 24.47 |
| F&B Revenue | 8.28 | 11.44 | 12.86 | 14.20 | 15.30 |
| Banquets & Events | 3.31 | 5.15 | 5.93 | 6.64 | 7.14 |
| Other Income | 1.38 | 2.15 | 2.48 | 3.08 | 4.08 |
| Total Revenue | 26.77 | 36.88 | 41.36 | 46.69 | 50.99 |
| Operating Expenses | 20.62 | 26.67 | 28.12 | 30.69 | 33.15 |
| EBITDA | 6.15 | 10.21 | 13.24 | 15.99 | 17.84 |
| Depreciation | 9.00 | 8.80 | 8.60 | 8.40 | 8.20 |
| Interest | 16.80 | 16.80 | 16.80 | 15.12 | 13.44 |
| PBT | (19.65) | (15.39) | (12.16) | (7.53) | (3.80) |
| Tax | 0.00 | 0.00 | 0.00 | 0.00 | 0.00 |
| PAT | (19.65) | (15.39) | (12.16) | (7.53) | (3.80) |
Notice that PAT remains negative through Year 5 in this illustrative scenario because depreciation and interest charges are heavy. However, EBITDA is positive and growing – and cash accrual (PAT plus depreciation) tells a very different story. This distinction is crucial for hotel profitability assessment and DSCR evaluation.
Cash Flow Projections and Hotel Loan Repayment Capacity
Accounting profit and cash flow are different. Lenders focus on how much cash the hotel actually generates to service debt. Luxury hotels forecast cash flow and working capital to map liquidity needs and verify that projected revenue generation translates into actual repayment capacity.
| Item (₹ Cr) | Yr 3 | Yr 4 | Yr 5 |
|---|---|---|---|
| PAT | (12.16) | (7.53) | (3.80) |
| Add: Depreciation | 8.60 | 8.40 | 8.20 |
| Cash Accrual | (3.56) | 0.87 | 4.40 |
| Working Capital Changes | (0.50) | (0.30) | (0.20) |
| Operating Cash Flow | (4.06) | 0.57 | 4.20 |
| Principal Repayment | 16.00 | 16.00 | 16.00 |
| Net Cash Flow after Debt Service | (20.06) | (15.43) | (11.80) |
This illustrative cash flow underlines why moratorium periods and realistic ramp-up schedules are essential. In the early years, even with positive EBITDA, the hotel may need promoter support or restructured repayment to avoid cash shortfalls. Hotels have specific working-capital dynamics: F&B inventory stocking, credit to corporate clients and OTAs (often 30–60 days), and seasonal pre-payments can absorb cash even in profitable periods.

Projected Balance Sheet for a Luxury Hotel
The projected balance sheet presents the hotel’s financial position at year-end. A strong balance sheet indicates a healthy ratio of assets to liabilities. In a bankable hotel DPR, it must logically reconcile with the P&L, cash flow and term-loan schedule.
On the asset side: property, plant and equipment (net of accumulated depreciation), inventories (F&B, linen, consumables), trade receivables, cash and bank balance. On the liabilities side: share capital, reserves and surplus (accumulated profits or losses), term loan outstanding, working-capital borrowings, trade payables and provisions.
| Balance Sheet (₹ Cr) | Year 3 |
|---|---|
| Net Fixed Assets | 193.80 |
| Inventories | 1.20 |
| Receivables | 3.50 |
| Cash & Bank | 2.00 |
| Other Assets | 1.50 |
| Total Assets | 202.00 |
| Share Capital | 100.00 |
| Reserves & Surplus | (47.20) |
| Term Loan | 144.00 |
| Working Capital Loan | 3.00 |
| Trade Payables | 2.20 |
| Total Liabilities | 202.00 |
Any inconsistency – such as principal repayments not reducing the term-loan balance – will be immediately noticed by bankers and can damage the proposal’s credibility.
Project Cost, Means of Finance and Linkage with Projections
All financial projections must originate from the project cost and means of finance statement. According to ICRA’s recent benchmarks, per-room development cost for five star hotel properties in India runs between ₹1.50 crore and ₹2.00 crore excluding land. For the illustrative 120-room hotel at ₹1.60 crore per key, the core project cost is approximately ₹192 crore, with land, pre-operative expenses, IDC and contingencies taking the total to ₹260 crore.
Down payments for hotels typically range from 20% to 40% of property value. In this example, promoter equity of ₹100 crore (about 38%) funds the balance after the ₹160 crore term loan.
A well-managed hotel can yield annual returns of 10–15%, but this depends entirely on the accuracy of the underlying projections. Readers should refer to the luxury hotel project cost and means of finance guide for detailed cost benchmarking. Average returns on hotel investments can range from 10% to 15% for stabilised, well-positioned properties.
DSCR and Term-Loan Repayment Capacity
DSCR (Debt Service Coverage Ratio) = Cash Available for Debt Service ÷ Total Debt Service (Interest + Principal) for the year. It is the single most important metric lenders use to judge whether the hotel project can actually service its proposed debt.
| Item (₹ Cr) | Yr 3 | Yr 4 | Yr 5 |
|---|---|---|---|
| EBITDA | 13.24 | 15.99 | 17.84 |
| Less: Tax | 0.00 | 0.00 | 0.00 |
| Cash Available for DS | 13.24 | 15.99 | 17.84 |
| Interest | 16.80 | 15.12 | 13.44 |
| Principal | 16.00 | 16.00 | 16.00 |
| Total Debt Service | 32.80 | 31.12 | 29.44 |
| DSCR | 0.40 | 0.51 | 0.61 |
This illustrative DSCR is below the typical lender minimum of 1.20–1.50× in stabilised years, highlighting the need for a longer moratorium, bullet repayments, or higher equity. In practice, hotel owners and promoters must calibrate loan quantum, tenure and moratorium to achieve bankable DSCR levels.
For context, a hotel with $800,000 NOI at a 7% cap rate is valued at $11.4 million – showing how operating income directly drives property value and lender comfort.
Common DSCR errors include calculating DSCR using profit before tax rather than cash accrual, ignoring principal repayments, or mismatching DSCR with the actual loan amortisation schedule.
Working Capital Requirements in Luxury Hotels
Even though hotels are service businesses, they need working capital for inventories, receivables and minimum cash balances. Typical items for a five star hotel include F&B stock (10–15 days), operating supplies, credit to corporate clients and OTAs (20–30 days receivables), GST payable/receivable, and a prudent minimum cash buffer.
Hotels have different working-capital dynamics from manufacturing – less raw material WIP but greater emphasis on receivables, pre-paid expenses and seasonal cash needs. Working capital interest and principal, where applicable, must be reflected in the projected cash flow and DSCR.
Break-Even Analysis and Break-Even Occupancy
Break even analysis helps promoters understand the minimum revenue and occupancy their hotel must achieve to cover operational expenses, and separately to cover both operating costs and debt service. Fixed costs (payroll, insurance, property taxes) remain relatively constant regardless of occupancy, while variable costs (F&B consumption, laundry, housekeeping supplies) move with rooms sold.
For the illustrative hotel with annual fixed operating costs of approximately ₹18 crore and variable cost per occupied room night of roughly ₹2,500, and ARR of ₹7,644 in Year 3, the operating break-even occupancy works out to approximately 48%. The cash break-even occupancy including debt service is significantly higher, which is why lenders are more concerned with the latter for project finance appraisals.
Readers seeking detailed break-even models can refer to the luxury hotel occupancy, ARR, RevPAR and break-even analysis guide.
Sensitivity Analysis, Scenarios and Stress Testing
No luxury hotel DPR is complete without sensitivity analysis. Luxury hotel performance forecasting considers economic sensitivity, and high-end properties deal with higher volatility in discretionary spending. Banks in India increasingly expect to see how projections behave under adverse conditions.
Key sensitivities to test:
| Scenario | Occupancy (Yr 5) | ARR (Yr 5) | Total Revenue (₹ Cr) | EBITDA (₹ Cr) | DSCR |
|---|---|---|---|---|---|
| Base Case | 68% | ₹8,232 | 50.99 | 17.84 | 0.61 |
| Occupancy -10% | 58% | ₹8,232 | 43.50 | 13.20 | 0.45 |
| ARR -10% | 68% | ₹7,409 | 46.10 | 15.10 | 0.51 |
| Costs +5% | 68% | ₹8,232 | 50.99 | 16.18 | 0.55 |
| Optimistic | 72% | ₹8,650 | 55.40 | 20.50 | 0.70 |
A bankable DPR should present Base Case (realistic), Optimistic Case and Stress Case. Never rely solely on an aggressive optimistic scenario. Use integrated luxury hotel financial models where changing key assumptions automatically updates all three financial statements and DSCR. Market trends, government initiatives supporting tourism infrastructure, and the broader tourism sector outlook all influence which scenario is most likely.
Financial Ratios, Bank Appraisal Focus and Common Projection Mistakes
From a banker’s perspective, credit officers scan a luxury hotel DPR in a specific sequence: project cost and means of finance, debt–equity ratio, projected occupancy and ARR, EBITDA margin trajectory, DSCR and promoter background. Key performance indicators derived from projections include:
- EBITDA margin (target: 25–35% stabilised)
- Net profit margin
- DSCR (annual and average over loan life, minimum 1.20–1.50×)
- Interest coverage ratio
- Debt–equity ratio (typically 60:40 to 70:30)
- Current ratio
- Return on investment and financial performance measures
Banks examine reasonableness of occupancy and average room rate assumptions against market data, sanity of the ramp-up period, robustness of cash flow in low season, and the promoter’s capacity to bring in equity. Marketing efforts and competitive positioning are also evaluated against market demand in the micro-market and business districts nearby.
Common mistakes in luxury hotel financial projections: unrealistic first-year occupancy, excessive ARR growth, ignoring seasonality, overestimating banquet revenue, underestimating payroll and electricity, wrong depreciation or interest calculations, no working-capital assessment, P&L not reconciling with cash flow and balance sheet, DSCR disconnected from loan schedule, and absence of sensitivity analysis. A hotel feasibility study that avoids these errors can materially improve the perceived financial viability and bankability of the proposal. Private investors and financial institutions alike examine these same fundamentals.
Integrated 5–10 Year Projection, Horizon Selection and Consolidated Example
Luxury hotel DPRs in India typically contain at least 5 years of detailed projections. Many banks prefer 7–10 years to cover the full loan tenure and stabilisation period. A 5-year horizon captures the ramp-up and near-term loan appraisal needs; a 10-year view helps assess full term-loan coverage and average revenue trajectory.
| Year | Occ% | ARR (₹) | Total Rev (₹Cr) | EBITDA (₹Cr) | PAT (₹Cr) | Cash Accrual (₹Cr) | Debt Svc (₹Cr) | DSCR |
|---|---|---|---|---|---|---|---|---|
| 1 | 45% | 7,000 | 26.77 | 6.15 | (19.65) | (10.65) | 16.80 | 0.37 |
| 2 | 55% | 7,315 | 36.88 | 10.21 | (15.39) | (6.59) | 16.80 | 0.61 |
| 3 | 60% | 7,644 | 41.36 | 13.24 | (12.16) | (3.56) | 32.80 | 0.40 |
| 4 | 65% | 7,988 | 46.69 | 15.99 | (7.53) | 0.87 | 31.12 | 0.51 |
| 5 | 68% | 8,232 | 50.99 | 17.84 | (3.80) | 4.40 | 29.44 | 0.61 |
This consolidated view demonstrates a critical reality: the illustrative project needs either more equity, a longer moratorium, higher occupancy, or restructured repayments to achieve bankable DSCR levels. This is precisely the kind of insight a professional hotel financial model template delivers – and precisely what promoters and the hotel owner need before approaching financial institutions.
Projections are estimates, not guarantees. Ongoing monitoring and re-forecasting during construction and early hotel operations are good financial management practices. Spiritual tourism, business travel and broader lodging industry trends can all shift the operating performance outlook during the projection period. A robust business plan accounts for these dynamics.
Practical CA Perspective: Preparing Bankable Luxury Hotel Financial Projections
As CA Manish Gugliya, I have prepared DPRs, CMA data and project-finance proposals for numerous hotel clients across India. A professional approach begins with the project cost and means of finance, then builds a driver-based revenue model, detailed operating cost schedules, term-loan drawdown and repayment plan, and finally integrated P&L, cash flow and balance sheet with DSCR analysis.
The most important principle is integration. Financial models should dynamically link inputs to outputs for accuracy. Any change in occupancy, ARR, project cost, loan quantum or interest rate should automatically flow through to revenue, profitability, cash flows, loan outstanding and DSCR. Projections prepared merely to produce an attractive DSCR – by, say, inflating Year-1 occupancy to 70% or ignoring management fees – create inconsistencies that become visible during bank appraisal and can derail the entire proposal.
In my experience, the most common correction involves aligning DSCR with a realistic ramp-up period and moratorium structure. In one typical situation, a promoter’s original DPR showed 65% occupancy from Year 1. After recalibrating to a realistic 45% ramp-up, extending the moratorium and adjusting the repayment schedule, the DSCR trajectory became defensible – and the loan was processed smoothly. Financial reporting built on genuine assumptions stands up far better than optimistic spreadsheets.
Promoters who require professional assistance preparing an integrated luxury hotel DPR, financial projections, CMA data and bank-loan documentation may find it valuable to work with experienced professionals through ProjectReportBank.com. The goal is always a coherent, evidence-backed financial model – not a promotional document.
Net present value analysis and profitability analysis using discounted cash flow methods can further strengthen the DPR for hotel investors, though these are supplementary to the core projections banks evaluate. Mezzanine capital structures and hybrid financing may also be relevant for certain projects.
FAQs on Luxury Hotel Financial Projections for DPR
The following questions address practical issues commonly raised by promoters, investors and bankers evaluating four star and five star hotel projections in India.
What additional historical data should be attached if the hotel is an expansion project?
For expansion or renovation of an existing luxury hotel, the DPR should attach at least 3 years of audited financial statements, occupancy, ARR and RevPAR data, departmental P&L, major capex history and existing loan schedules. This historical operating performance is used to calibrate future projections and gives lenders confidence that revenue and cost assumptions are grounded in actual hotel operations rather than theoretical estimates.
How often should luxury hotel financial projections be revised during development?
Projections should be revisited whenever there is a material change in project cost, room inventory, facility mix, construction timeline, interest rate or brand and management structure. During a typical 24–36 month construction period, at least two formal revisions are advisable. Regular updates help promoters anticipate additional equity requirements and maintain transparency with lenders.
Do banks in India insist on any standard occupancy or DSCR for 5-star hotels?
There are no universal fixed thresholds applicable to every bank or hotel project. Each lender applies its own internal credit policy, risk appetite and market understanding. However, more conservative, evidence-backed assumptions with acceptable DSCR under both realistic and stress scenarios – typically 1.20× or higher in stabilised years – generally improve appraisal comfort. The final lending decision is always subject to the individual lender’s credit policy and project-specific assessment.
How should management or franchise fees be treated in luxury hotel projections?
Base management fees (typically 2–3% of total hotel revenue) and incentive fees (often 8–12% of GOP) payable to branded operators should be clearly modelled as operating expenses linked to revenue or profits, as per the management agreement term sheet. Promoters must ensure these management fees are fully considered when estimating EBITDA, cash accrual and DSCR. Ignoring them overstates the cash available for debt service.
Can projections and CMA data be updated after loan sanction if assumptions change?
While substantive changes post-sanction typically require lender discussion and sometimes formal approval, banks do expect periodic updated projections and CMA data during the loan tenure. This is especially important if there are cost overruns, construction delays or significant deviations in occupancy and ARR versus the original DPR assumptions. Realistic, assumption-driven, integrated financial projections – rather than optimistic spreadsheets – are what ultimately improve the bankability and credibility of a luxury hotel DPR in India.
Explore More Luxury / 4-Star & 5-Star Hotel Project Report Guides
Continue exploring our Luxury, 4-Star and 5-Star Hotel DPR guides covering setup cost, equipment, project cost, revenue, financial projections, occupancy, feasibility, project finance and bank loan assessment.