
Key Takeaways
- An ice cream plant revenue model depends on product mix, trade margins, cold-chain reach and seasonality, not only on installed capacity. Ice cream plants can adopt multiple revenue models for sustainability.
- A viable industrial ice cream business model must integrate manufacturing economics with an efficient ice cream distribution network and realistic ice cream business seasonality assumptions.
- For a bankable DPR, revenue projections must be prepared product-wise, channel-wise and month-wise, with explicit treatment of discounts, returns and off-season demand. Break-even for ice cream manufacturing typically ranges from 3 to 5 years.
- Cold-chain reliability, freezer deployment strategy and distributor viability influence ice cream manufacturing profitability at every stage of the value chain.
- This article reflects practical advisory experience of CA Manish Gugliya in project reports, ice cream plant financial projections and working-capital assessment for Indian conditions.
Introduction: Commercial Reality of an Industrial Ice Cream Plant
The revenue model of an industrial ice cream manufacturing plant is shaped by product mix, MRP-to-net-realisation gaps, trade margins, distribution network design and sharp demand seasonality across India. Manufacturing capacity or litres per day alone do not decide success. The industrial ice cream business model also relies on brand positioning, freezer presence, cold-chain uptime and route-to-market execution.
The global ice cream market was valued at USD 78.57 billion in 2025, and the ice cream market is projected to reach USD 102.38 billion by 2034, driven by rising demand for premium frozen desserts. In India, the market crossed INR 243 billion in 2025 and is forecast to reach INR 639 billion by 2034 at a CAGR of approximately 11.29%. Before locking plant capacity and capital cost, promoters must evaluate ice cream plant revenue model scenarios, distribution reach, realistic selling prices and seasonality impact on capacity utilisation.
This article is written for entrepreneurs, lenders and investors preparing or appraising an industrial ice cream manufacturing plant project report in India. Sections focus on revenue architecture, distribution economics and ice cream business seasonality.
Understanding the Industrial Ice Cream Business Model
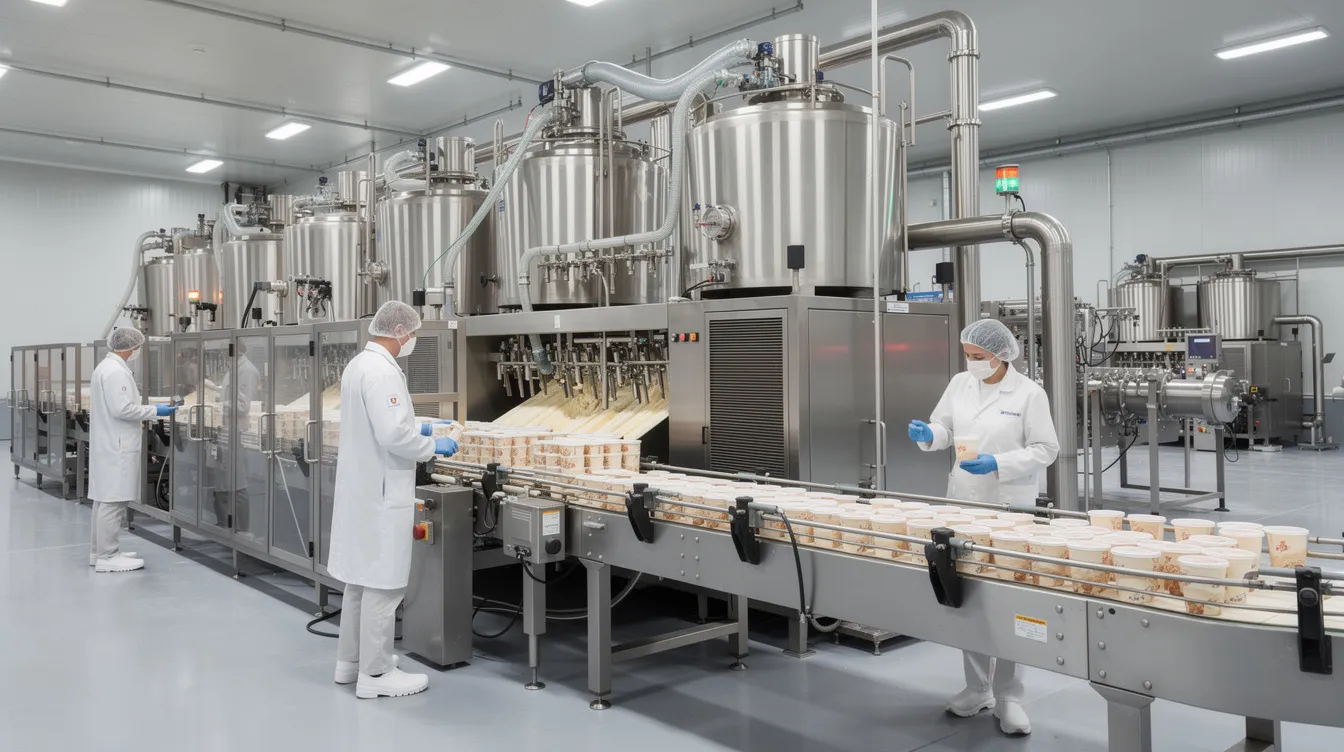
The end-to-end flow of an ice cream business runs from procurement through ice cream production, frozen storage, cold-chain movement, wholesale distribution, retail execution and consumer purchase.
Procurement covers milk, cream, skim milk powder, sugar, flavours, stabilisers, emulsifiers and packaging material. Raw materials, especially milk cream, account for 60-70% of operating costs. This ingredient cost structure directly influences ice cream manufacturing profitability. The manufacturing process; mixing, pasteurisation, homogenisation, ageing, freezing, filling and hardening; is covered in detail in the article on industrial ice cream manufacturing process and production line.
Finished goods move via refrigerated vehicles to company depots, C&F agents, super-stockists and distributors, then into retail freezers, parlours, HoReCa outlets, institutions and quick-commerce partners. The ice cream industry combines manufacturing, branding, cold-chain logistics, distribution management and retail activation, making it far more complex than a commodity dairy operation. Cash realisation depends on credit terms, damage and expiry replacement, scheme stock and trade claims, making receivable management a key factor in the business model.
Major Revenue Streams of an Ice Cream Plant
An ice cream plant’s revenue model is multi-product and multi-channel. Ice cream manufacturing often involves a mix of revenue streams to reduce risk. The primary categories include:
- Single-serve impulse products: cups, cones, sticks, bars, candy products. Impulse products make contributions to overall sales volume; in India, impulse ice cream accounted for about 60.60% of the market in 2025.
- Family packs and tubs: take-home consumption. Tubs now contribute over 40% of ice cream category sales in India.
- Premium ice cream: specialty flavours such as chocolate, vanilla, mango, coffee, fruit combinations, and toppings-based variants.
- Traditional Indian flavours: kulfi, rabdi-based, and Indian mithai-inspired products.
- Institutional and HoReCa packs: bulk packs for restaurants, hotels, caterers.
- Private-label and contract manufacturing: contract manufacturing allows plants to produce ice cream for third-party brands, while private label production secures predictable volume at lower margins.
- Frozen desserts: where legally and commercially applicable.
- Franchising: generates revenue through fees and royalties from local operators running branded ice cream shops or parlours.
Basic sticks and cups serve as high-volume, lower-margin volume drivers. Premium tubs, specialty kulfi and novelty bars generate higher contribution per unit but move slower. Healthier ice cream formats; low sugar, fruit-based, functional varieties; account for roughly 10% of sales but new dietary trends create premium opportunities in ice cream production. Seasonal and functional product innovation can drive higher retail prices.
Product Mix and Revenue Contribution
A common mistake in DPR preparation: projecting turnover by multiplying total plant capacity by one average selling price per litre. This ignores the reality that each product format carries different net realisation, margin, packaging cost and seasonal sensitivity.
A structured product mix balances mass-market volume products with higher-contribution SKUs. An illustrative framework (all figures are examples only):
| Product Category | Pack Size | Target Customer | Relative Margin | Seasonal Sensitivity |
|---|---|---|---|---|
| Economy sticks | 60 ml | Mass retail | Low | High |
| Impulse cups | 100 ml | General trade | Medium | High |
| Cone variants | 120 ml | Retail, parlours | Medium-High | High |
| Premium tubs | 500 ml | Modern retail, D2C | High | Medium |
| Family bricks | 1 litre | Take-home, stores | Medium | Medium |
| Institutional bulk | 5 litre | HoReCa, caterers | Low-Medium | Low |
| Contract manufacturing | Various | Third-party brands | Low | Low |
Promoters must build their own assumptions from local market feedback, quotations and competitor pricing. Contribution per litre, contribution per production hour and contribution per freezer facing all matter; an SKU that consumes filling time and freezer space inefficiently may be commercially weak even if its gross margin per unit looks attractive. Product-mix decisions also influence line changeovers, packaging SKU count, inventory complexity and write-offs for slow-moving flavours.
Customer-Segment-Based Revenue Model
Revenue streams must also be analysed by customer segment. B2C models include retail packaged sales through supermarkets and stores. B2B distribution involves selling ice cream in bulk to businesses such as hotels, caterers and institutional canteens.
| Channel | Order Size | Margin Pressure | Credit Period | Seasonality |
|---|---|---|---|---|
| General trade (kirana) | Small, frequent | Moderate | 7-15 days | High |
| Ice cream parlours | Medium | Moderate | 7-21 days | High |
| Modern retail / supermarkets | Large | High (listing fees) | 30-45 days | Medium |
| HoReCa (hotels, restaurants) | Medium-Large | Moderate | 30-60 days | Low-Medium |
| Caterers and events | Large, seasonal | Low-Moderate | Advance or 15 days | Seasonal |
| Institutional canteens | Steady, medium | Low | 15-30 days | Low |
| Online grocery / quick commerce | Variable | High (platform fees) | 15-30 days | Medium |
| D2C / company outlets | Variable | Low (no intermediaries) | Immediate | Medium |
| Private-label clients | Large, contracted | Low margin | 30-45 days | Low |
Direct-to-Consumer sales capture higher margins by eliminating intermediaries. Catering for events can maximize revenue during peak seasons. E-commerce platforms can expand reach and profitability for ice cream brands; India’s Quick Commerce ice cream market is projected to reach ₹1,300 crore by Summer 2026. Mixing channels; combining institutional bulk with branded retail packs; stabilises revenue and improves ice cream plant capacity utilisation across the year.
Pricing and Trade-Margin Structure
MRP on pack is not the manufacturer’s income. Several cost layers stand between MRP and the manufacturer’s net realisation.
Illustrative MRP-to-net-realisation waterfall (₹20 impulse stick, example only):
| Component | Amount (₹) | % of MRP |
|---|---|---|
| MRP | 20.00 | 100% |
| Less: Retailer margin (~20%) | 4.00 | 20% |
| Less: Distributor margin (~10%) | 1.60 | 8% |
| Less: Schemes / promotions | 0.80 | 4% |
| Less: Freight and handling | 0.60 | 3% |
| Less: Returns, damages, expiry | 0.50 | 2.5% |
| Net realisation to manufacturer | 12.50 | 62.5% |
Trade margins vary by competition, brand, region, pack type and channel. In India, Amul and Kwality Walls hold nearly 50% market share, so they negotiate from a position of brand strength; a new entrant will face different margin pressures. Ice cream manufacturing plants have gross profit margins of 40-50% at scale, but this depends on product mix and the price at which milk, cream and sugar are procured.
Promotional schemes like buy-one-get-one, extra quantity packs and free stock reduce effective net realisation. For a realistic ice cream plant revenue model, DPRs must deduct expected returns, damages and GST obligations (currently 5% on manufactured ice cream) from gross billing values.
Ice Cream Distribution Network in India
An efficient ice cream distribution network is central to the industrial ice cream business model. The typical hierarchy:
- Factory dispatch and hardening
- Company-owned cold-storage depot or C&F agent
- Super-stockist
- Regional and local distributors
- Retailers, parlours, institutional buyers
- Final consumer (the person who will eat ice cream at home or on-the-go)
A company may use direct distribution for large chains and institutions, a distributor-based model for widespread general trade, or a hybrid approach. Strategic partnerships enhance market penetration in the ice cream industry, especially when entering new territories. For single-city operations, a company depot with 5-10 distributors may suffice. Multi-state expansion requires C&F agents, regional depots and 50+ distributors, each with cold-storage access.
Distribution design must align with planned plant capacity, product mix and freezer deployment budgets. Over 12,700 businesses operate in the ice cream stores industry in the U.S.; in India, the network is more fragmented and cold chain infrastructure remains the binding constraint for growth and scale.
Cold-Chain Distribution Requirements
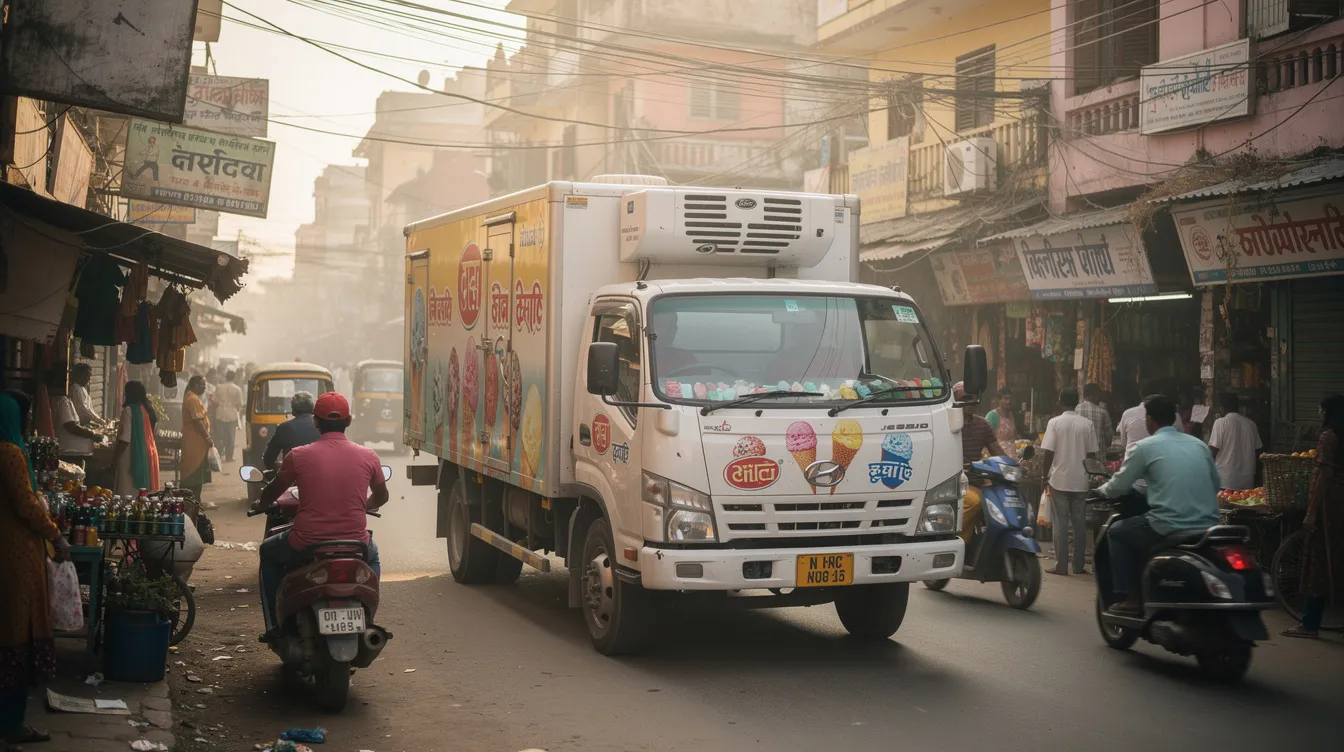
Temperature control from -18°C to -25°C is non-negotiable from factory gate to retail freezer. Each node; hardening tunnel, main frozen storage, refrigerated vehicle, distributor cold room, retail freezer; is a potential failure point. Technical cold-storage design is discussed separately in the article on ice cream cold storage and hardening tunnel requirements.
Weak cold-chain distribution increases replacement cost, reduces net realisation, damages brand equity and forces deeper schemes or discounts to regain consumer trust. Power backup, temperature monitoring, preventive freezer maintenance and clear return policies are essential. Route planning must account for fuel cost, vehicle turnaround time and night deliveries in dense urban areas; all of these add to delivery cost per litre.
Retail Freezer Deployment Strategy
Branded chest freezers at retail points are revenue-generating assets, not just costs. Commercial models include company-owned freezers placed at outlets (with security deposits), distributor-owned freezers and retailer-owned units with partial brand support. Outlet selection depends on footfall, shop visibility, power reliability and competition presence.
Illustrative freezer payback (example only):
| Parameter | Value |
|---|---|
| Freezer capex | ₹18,000 |
| Expected monthly sales (retail value) | ₹12,000 |
| Manufacturer’s gross margin on sales | ~40% |
| Monthly contribution | ~₹4,800 |
| Estimated payback period | ~4 months |
Actual payback depends on outlet performance, product mix, summer vs winter sales and electricity costs. Idle freezers in the off-season affect ice cream business working capital and asset returns. Promoters should track sales per freezer monthly and relocate or withdraw units that consistently underperform.
Distribution Territory and Route Planning
Choosing the right territories for an ice cream wholesale distribution model depends on population density, climate, urbanisation, income levels and competition. Key selection factors include distance from plant, road connectivity, availability of cold-storage partners, count of suitable retail outlets per route and presence of institutional buyers such as schools, IT parks and tourist spots.
Route density (outlets per kilometre) and drop size (average litres per delivery) determine whether a route is profitable. Poor route density and small drops erode margins quickly. Early-stage plants should prioritise depth in limited territories over thin presence across multiple states.
Seasonality in the Ice Cream Business
Ice cream business seasonality in India follows a pattern shaped by temperature, rainfall, festivals, school holidays and wedding seasons. If you have ever wondered why consumption peaks between March and May, the answer is straightforward: people eat ice cream far more frequently when temperatures cross 35°C.
Historical data suggests that in many North Indian markets, March to May accounts for roughly 45% of annual volume, monsoon months around 30%, October to November about 20%, and winter barely 5%. Southern and coastal states show less extreme variation. Wedding and festival seasons create localised demand spikes.
An illustrative quarterly demand index (example only):
| Quarter | Demand Index | Remark |
|---|---|---|
| Jan-Mar (pre-summer) | 70-90 | Building up, still winter in north |
| Apr-Jun (peak summer) | 140-160 | Peak production and selling period |
| Jul-Sep (monsoon) | 80-100 | Reduced outdoor consumption |
| Oct-Dec (winter) | 50-70 | Lowest in cold regions |
Promoters must collect local market data; retailer feedback, competitor sales patterns, and festival calendars; instead of assuming one seasonal pattern for the entire country.
Effect of Seasonality on Capacity Utilisation
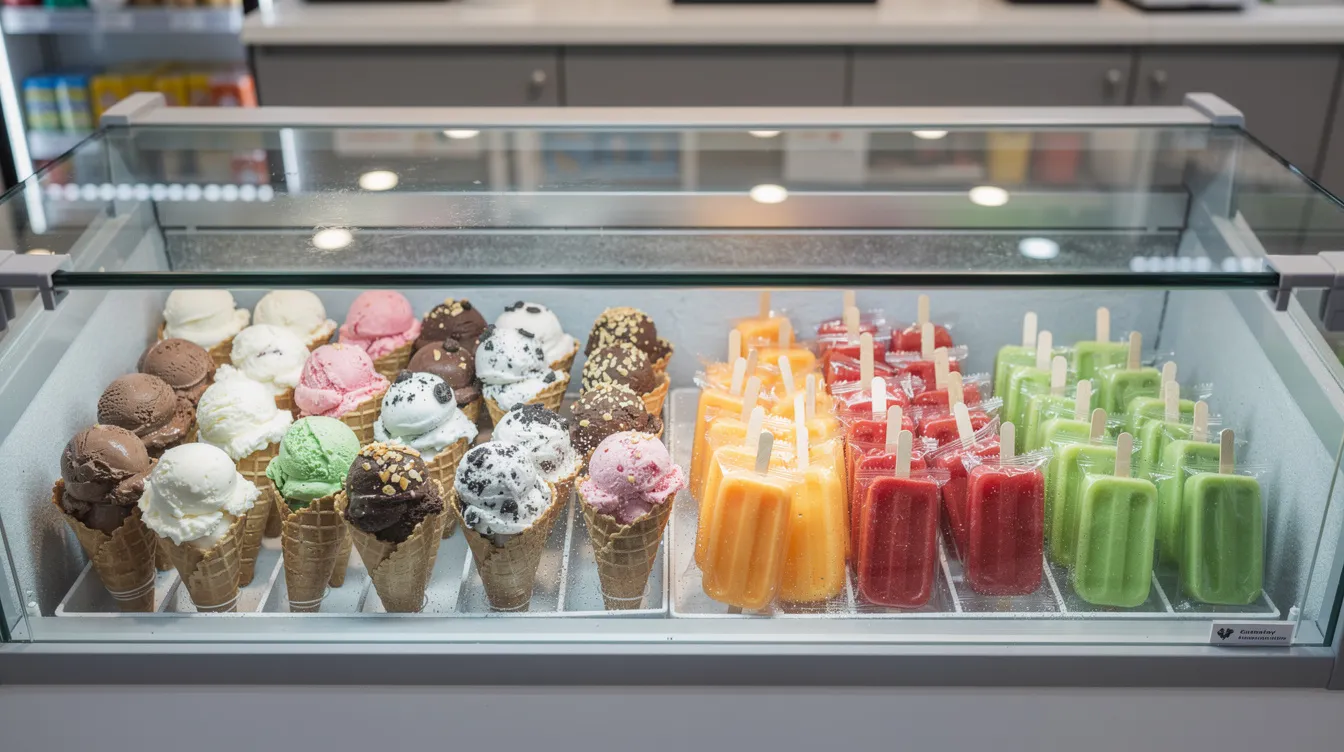
Ice cream plant capacity utilisation must be viewed month-wise, not only as an annual average. A plant may run at 90-95% capacity in April and May but drop to 30-40% in December and January. Maximizing plant capacity utilization improves profitability, but the installed capacity must match peak-month demand, not the annual average.
Peak-season production requires extended shifts, higher labour deployment and full cold-storage capacity. Raw-material procurement; milk, cream, sugar; needs advance planning to ensure availability and price stability before summer. Cash-flow implications are direct: higher working capital during pre-season build-up, followed by lower revenue months that strain loan instalment servicing. DPRs for ice cream plant financial projections should show monthly or at least quarterly capacity utilisation, not just an annual percentage.
Off-Season Revenue Strategy
Seasonality cannot be fully eliminated. Practical strategies to smooth revenue include:
- Institutional and HoReCa contracts: hotels, restaurants, corporate canteens provide relatively steady, year-round demand.
- Product strategies: family packs for in-home consumption, premium dessert lines, winter-friendly flavours (dry fruit, chocolate, Indian mithai variants) and festival-driven SKUs. Product innovation matters; a scoop of well-crafted seasonal kulfi or a fun mango-based novelty can generate repeat purchases even in cooler months.
- Private-label and contract manufacturing: provide base volume during cooler months. Margins are lower than branded business, but the idea is to keep the plant running.
- Geographic expansion: targeting warmer or tourist-heavy markets to diversify climate risk, while noting the added logistics and working-capital burden.
- Distributor incentive schemes and consumer promotions: must be budgeted realistically. Cheap discounts that erode contribution margins do more harm than idle capacity.
Sustainable operations can provide additional revenue streams from byproducts such as whey or buttermilk, partially offsetting off-season fixed costs. Sustainable packaging solutions can also create brand value that supports premium pricing.
Production and Distribution Planning for Peak Season
A well-run ice cream plant prepares months before summer with coordinated planning:
- Finalise seasonal product mix and secure raw-material and packaging contracts
- Complete preventive maintenance of process equipment, freezers and refrigerated vehicles
- Verify cold-room and hardening tunnel capacity
- Deploy new freezers, relocate underperforming units, finalise exclusive outlet tie-ups
- Confirm distributor network readiness, allocate territories, recruit seasonal sales staff
- Ensure adequate working-capital limits from banks before inventory build-up begins
Promoters must ensure that bank limits, whether for term-loan drawdowns or working-capital facilities, are sanctioned well before the peak period.
Relationship Between Capacity, Machinery and Revenue
Plant capacity decisions should arise from a realistic ice cream plant revenue model and distribution reach, not from machinery vendor quotations alone. Machinery capacity for mix preparation, continuous freezers, filling machines and hardening tunnels must align with targeted product mix and peak-season output needs.
Bottleneck risks happen when one part of the process lags: high pasteurisation capacity but slow filling lines, large cold rooms but limited vehicle availability, or strong plant capacity but weak distribution penetration. Details on automatic ice cream plant machinery and equipment cost are covered separately. Overly optimistic capacity-utilisation assumptions in DPRs (jumping to 80-90% in the first year) without supporting distribution plans create a gap between projection and reality.
Revenue Forecasting for the Project Report
Revenue must be built SKU-wise and channel-wise, not by applying a flat per-litre price to total capacity.
Forecasting steps:
- Define installed capacity (litres per day)
- Assume realistic ramp-up in capacity utilisation over the first 3-5 years
- Allocate capacity to different product categories and sales channels
- Build monthly or quarterly sales volumes reflecting seasonality
- Apply net realisation (after trade margins, schemes and expected returns) for each product category
Formula: Product-wise annual revenue = Saleable quantity (litres or pieces) x Net sales realisation per unit
Revenue forecasting should reflect geographic expansion plans, gradual distributor appointment, and realistic price escalation. Total operational costs rise due to inflation and market fluctuations; operating costs are projected to increase by year five, so projections must account for this.
Illustrative Revenue Projection
The following example is for a mid-sized Indian ice cream plant (all figures illustrative, not industry benchmarks):
| Product Category | Capacity Utilisation | Saleable Qty (litres/yr) | Net Realisation (₹/litre) | Gross Revenue (₹ lakhs) | Less: Returns/Discounts | Net Revenue (₹ lakhs) |
|---|---|---|---|---|---|---|
| Economy sticks | 60% | 2,40,000 | ₹110 | 264 | 3% | 256 |
| Impulse cups/cones | 55% | 1,80,000 | ₹130 | 234 | 3.5% | 226 |
| Premium tubs | 45% | 90,000 | ₹200 | 180 | 2% | 176 |
| Family packs | 50% | 1,20,000 | ₹150 | 180 | 2.5% | 176 |
| Institutional bulk | 40% | 60,000 | ₹95 | 57 | 1.5% | 56 |
| Total | 6,90,000 | 915 | 890 |
Premium tubs contribute a higher percentage of net revenue despite lower volume. Institutional packs help stabilise baseline revenue. The same framework can be adapted channel-wise for more detailed DPRs.
Working-Capital Impact of the Distribution Model
An aggressive ice cream distribution network increases working-capital requirements through distributor credit, cold-chain inventory and freezer investments. Capital investments cover machinery, land, and initial working capital. Key components:
- Raw-material stocks (milk, cream, sugar, flavours): 10-15 days
- Packaging inventory: 15-20 days
- Finished goods (factory and depots): 7-15 days
- Trade receivables: 15-30 days depending on channel
- Less: trade payables: 10-20 days
The working-capital cycle for dairy value-added products including ice cream averages 25-30 days. Seasonal peaks push this higher. DPRs should project month-wise or quarter-wise working-capital needs to ensure adequate bank limits. Rapid revenue growth can increase working-capital strain if distributor credit and inventory are not controlled.
Key Performance Indicators for an Ice Cream Plant Revenue Model
| KPI | What It Measures |
|---|---|
| Net realisation per litre | Actual revenue retained after all trade deductions |
| Contribution per litre | Net realisation minus variable cost |
| Sales per freezer (monthly) | Freezer productivity and outlet health |
| Sales return % | Quality, cold-chain and forecasting effectiveness |
| Distributor receivable days | Credit discipline and cash-flow speed |
| Monthly capacity utilisation | Seasonal production efficiency |
| Route delivery cost per litre | Distribution cost-effectiveness |
| Cold-chain loss % | Melt, damage and spoilage rate |
Track these KPIs monthly. Use them to adjust product mix, rationalise underperforming freezers, support or replace weak distributors and refine pricing or scheme strategies. These are the key factors that separate profitable plants from those that merely produce ice cream.
Key Risks in the Ice Cream Plant Revenue Model and Mitigation
| Risk | Likely Impact | Mitigation |
|---|---|---|
| Heavy summer dependence | Cash-flow strain in off-season | Institutional contracts, HoReCa, contract manufacturing |
| Overestimated volume projections | Idle capacity, higher unit costs | Conservative DPR assumptions, downside testing |
| Weak distributor performance | Lost market access, slow collections | Regular review, backup appointments, credit limits |
| Cold-chain failure | Product damage, brand erosion, returns | Power backup, maintenance AMC, temperature monitoring |
| Price competition | Margin compression | Product differentiation, premium SKUs, brand building |
| High freezer capex with low utilisation | Poor asset returns | Outlet audit, relocation policy, sales-per-freezer tracking |
| Regional concentration | Climate and market risk | Phased geographic expansion |
Promoters should include downside scenarios in their ice cream plant financial projections, testing sensitivity to lower sales, lower net realisation and higher logistic costs.
Connection with Plant Setup, Project Cost and Finance
The chosen ice cream distribution network and revenue model directly affect physical plant setup: cold-room sizing, number of refrigerated vehicles, depot scale and freezer count. Ice cream plant setup costs include machinery and land expenses, but also cold-chain and distribution-launch budgets. ProjectReportBank.com provides separate detailed guidance on industrial ice cream plant setup cost in India.
Lenders assess whether the proposed capital structure; term loan, promoter contribution and working-capital limits; is compatible with the planned distribution spread and seasonality-driven cash flows. The ice cream plant project cost and means of finance article covers this in detail.
Importance of Revenue Model in a Bankable DPR
Banks and financial institutions examine whether the ice cream plant revenue model is realistic, supported by market logic and consistent with the proposed capacity and distribution plan. Appraisers look at product-wise and channel-wise revenue projections, evidence of market demand, promoter’s FMCG or dairy distribution experience and distributor appointment pipeline.
Credit professionals review monthly or quarterly sales and cash-flow patterns, break-even sales volumes, DSCR coverage in low-demand months and sensitivity to lower-than-expected summer sales. Break-even for ice cream manufacturing typically ranges from 3 to 5 years. A well-prepared DPR improves understanding and transparency but cannot guarantee loan sanction, as each lender applies its own policies and risk appetite.
Practical Recommendations from CA Manish Gugliya
Based on over two decades of DPR and project-finance work, we recommend the following to promoters:
- Validate target territories, climate conditions, outlet universe and distributor interest before finalising plant capacity. Distribution reach must stand on its own before money is committed to equipment.
- Prepare product-wise and channel-wise revenue projections with conservative assumptions, supported by ground-level surveys and actual distributor discussions.
- Budget adequately for freezers, cold-chain logistics, schemes and working capital. Allocating most funds only to process machinery is a common and costly planning error.
- Perform downside analysis for one weak summer season (e.g., due to unexpected rains or competition) and check whether the project can still service term-loan obligations during that period.
- Never treat MRP as manufacturer’s net revenue. Build margin structures, returns and seasonality transparently into the DPR. Brands like Baskin Robbins and Amul have access to distribution depth that a new entrant cannot replicate on day one; plan accordingly.
The world of ice cream manufacturing rewards those who plan distribution with the same rigour they apply to the manufacturing process itself. Success in this business relies on getting ice cream to the consumer’s hand at the right temperature, at the right price, through the right channel, at the right time of year.
Frequently Asked Questions
What are the main revenue sources of an industrial ice cream plant?
Primary revenue streams include branded single-serve products (cups, cones, sticks, bars), family packs and tubs, kulfi and traditional flavours, premium and specialty lines, institutional and HoReCa bulk packs, private-label assignments and contract manufacturing. Franchising generates additional revenue through fees and royalties from local operators. Some SKUs serve as volume drivers while others serve as margin drivers; both are needed for a balanced ice cream plant revenue model.
How does an ice cream distribution network work?
Products move from the factory cold room to regional depots or C&F agents, then to super-stockists and distributors, and finally to retailers, parlours, institutions and online delivery partners. Refrigerated vehicles, distributor cold rooms and branded freezers at the point of sale maintain the cold chain. The network design varies based on whether the operation is a single-city, regional or multi-state business.
What margin is generally provided to ice cream distributors and retailers?
There is no single standard margin for the ice cream industry. Distributor margins commonly fall in the 8-12% range, and retailer margins around 15-20% of MRP, but these percentages vary by brand strength, region, channel, product type and negotiation. Promoters should conduct local benchmarking with potential distributors and build DPR assumptions from actual discussions rather than generic figures.
How does seasonality affect ice cream plant profitability?
Strong summer peaks can cover a large share of annual fixed costs, but weak off-season demand increases idle capacity, underutilised freezers and working-capital strain. Profitability depends on how efficiently the plant uses peak months, manages inventory through monsoon and winter, and builds stable institutional and take-home sales. Monthly cash-flow planning is essential for loan-instalment servicing.
Is a large manufacturing capacity sufficient for business success?
Large capacity without corresponding distribution reach, cold chain infrastructure and realistic product-mix planning can lead to underutilisation, high fixed costs and cash-flow stress. A market-tested ice cream plant revenue model and distribution strategy is as important as machinery size when evaluating project viability. The right plan will create a path to growth; the wrong one will leave expensive equipment sitting idle through half the year.
Conclusion and Professional Call to Action
A sustainable industrial ice cream business model requires alignment of plant capacity, product mix, ice cream distribution network, cold chain infrastructure, pricing, trade margins and working capital with realistic seasonality assumptions. A bankable DPR presents transparent, product-wise and channel-wise revenue projections with sensitivity analysis, not optimistic top-line figures alone.
CA Manish Gugliya, through ProjectReportBank.com, assists entrepreneurs and businesses in preparing industrial ice cream manufacturing plant project reports, detailed project reports, financial projections, CMA data, project-cost and means-of-finance statements, working-capital assessments, DSCR and viability analyses. If you are planning an ice cream plant or expanding an existing dairy operation into frozen products, professional support in structuring a realistic revenue model and distribution plan can make the difference between a project that secures finance and one that does not.