
Key Takeaways
- An ice cream plant feasibility study evaluates market demand, technical setup, project cost, cash flows, ROI, IRR, NPV, DSCR and risk exposure before committing large capital to an industrial ice cream manufacturing project in India.
- As CA Manish Gugliya, I use integrated financial projections and discounted cash flow analysis to test ice cream plant project viability under Indian market conditions, financing structures and regulatory requirements.
- Bankable projections must reflect realistic capacity utilisation, seasonal sales patterns, working capital cycles, food safety compliance and cold-chain constraints specific to the proposed location and product mix.
- Ice cream plant ROI analysis, IRR calculation and sensitivity analysis are essential tools for investors, banks and promoters to judge returns, repayment capacity and resilience under adverse scenarios.
- All numerical examples in this article are purely illustrative, not industry benchmarks or assurances of profitability. Actual results depend entirely on project-specific assumptions.
Introduction: Why an Ice Cream Plant Feasibility Study Is Essential
As a practising Chartered Accountant advising on industrial project reports and bank finance, I have seen promoters commit tens of crores to an ice cream factory without rigorously testing whether the investment makes financial sense under realistic operating conditions. The excitement around India’s growing frozen desserts market is understandable, but conducting a feasibility study for an ice cream manufacturing plant requires evaluating market demand, technical design, capital requirements, profitability, cash flows and debt repayment capacity before a single brick is laid or a machine ordered.
Technical feasibility alone is not enough. A promoter must assess whether the proposed project can generate sufficient revenue, maintain healthy margins through seasonal swings, service term-loan obligations, and deliver acceptable returns on invested capital. An ice cream plant feasibility study is a detailed, multi-dimensional assessment of market, technical, financial and regulatory viability of an industrial ice cream manufacturing project, designed to help decision makers answer one question: should this money be deployed here, at this scale, with this financing structure?
A professionally prepared DPR and financial model, customised to Indian banking requirements, helps entrepreneurs, dairy companies and investors make informed go/no-go and sizing decisions. This article walks through the complete analytical framework. All projections and figures discussed are for general guidance; actual outcomes depend on project-specific assumptions, execution quality and prevailing market conditions.
What Is an Ice Cream Plant Feasibility Study?
An industrial ice cream plant feasibility report is a structured document that examines whether a proposed ice cream manufacturing project can be built, operated and sustained as a commercially viable enterprise over a 7–10 year horizon. Its purpose is to move beyond enthusiasm and into evidence-based analysis.
The study covers several interconnected components. Market feasibility examines whether realistic sales volumes and pricing exist in the target geography. Technical feasibility confirms that the proposed plant layout, machinery and utilities can deliver the planned capacity and product mix. Operational feasibility looks at raw material availability, staffing, production scheduling and quality systems. Financial feasibility tests whether projected revenues, costs, cash flows and returns justify the capital outlay. Funding feasibility assesses whether the financing structure is achievable and sustainable. Regulatory feasibility covers food safety licensing, environmental clearances and labelling compliance. Risk assessment identifies factors that could undermine viability. Finally, promoter and management capability evaluates whether the team can execute the plans effectively. Together, these components determine whether the project is commercially sustainable and bankable. Each feasibility report should be customised for specific capacity ranges (for example, 5,000 to 25,000 LPD), product mix covering cones, cups, family packs and bulk variants, plant location and the proposed financing pattern.
Market Feasibility of an Industrial Ice Cream Plant in India
Market feasibility evaluates whether projected sales volumes and selling prices are realistic in the proposed geography and channel mix. Without credible demand estimates, every subsequent projection in the financial model rests on sand.
The global ice cream market was valued at USD 78.57 billion in 2025, and India remains one of the fastest-growing segments within it. In 2024, India’s ice cream market reached approximately INR 202,339 million, growing at a CAGR of roughly 13.7% over 2022–2024. Yet per capita consumption stands at just 0.5 litres per person, signalling large untapped potential. Market sizing should account for population, disposable income, and dairy consumption trends in the specific districts or states being targeted.
Ice cream demand typically peaks during warmer months due to seasonal consumption patterns, with summer volumes often running three to four times higher than winter. This directly affects annual capacity utilisation, working capital and cash flows. Retail channels for ice cream include supermarkets, convenience stores, and restaurants, alongside institutional buyers such as QSR chains, hotels and caterers. Cold chain infrastructure is critical for maintaining ice cream quality during distribution, and its availability in the target region can make or break the project’s reach.
The feasibility study should assess demand for different SKU categories: impulse products like cups, cones and sticks make up roughly 60.8% of market value, while take-home packs are growing at a faster rate. Assessing market potential requires analyzing consumer demand trends and raw material sourcing in the proposed geography. Product positioning strategies can range from mass-market to premium artisanal offerings, and analyzing competitor offerings helps identify market gaps in flavor and product types. Competition from established brands like Amul, Kwality Walls, Vadilal and Mother Dairy means that a new entrant must define clear differentiation.
As a best practice, plant capacity should be chosen based on realistic market absorption and distribution capacity, not just what machinery suppliers are offering. A detailed analysis of revenue model, distribution network and seasonality should inform these decisions.
Technical and Operational Feasibility of the Ice Cream Factory
Technical and operational feasibility ensures that the proposed plant layout, machinery and utilities can deliver the planned capacity and product mix with acceptable production efficiency. This analysis prevents the common mistake of acquiring processing equipment without matching refrigeration, hardening and storage capacity.
Industrial ice cream plants typically require an annual production capacity of 10,000 to 20,000 MT, depending on market ambition. Installed capacity is usually expressed in litres per day (LPD), and the feasibility study must define whether the plant will operate in single or double shifts, the batch sizes for each product, and scheduling that minimises changeover losses across SKUs. The ice cream manufacturing process includes stages from ingredient receiving to cold storage, with each stage requiring matched throughput.
Several critical technical factors require evaluation. Utilizing high-capacity electrical power is vital for ice cream production facilities given the refrigeration, hardening and freezing loads involved. The process begins with mixing at a temperature typically between 40 to 60 degrees Celsius, followed by pasteurization at 80 to 85 degrees Celsius for 15 to 25 seconds. Homogenization reduces fat globule size to under 1 micron, creating the smooth texture consumers expect. Ice cream must contain at least 5% milk fat to be classified as dairy ice cream; this standard applies in India as well as in the UK and EU. Freezing incorporates air into the mix, setting the overrun during production, and standard ice cream typically runs at 90 to 110% overrun for profitability.
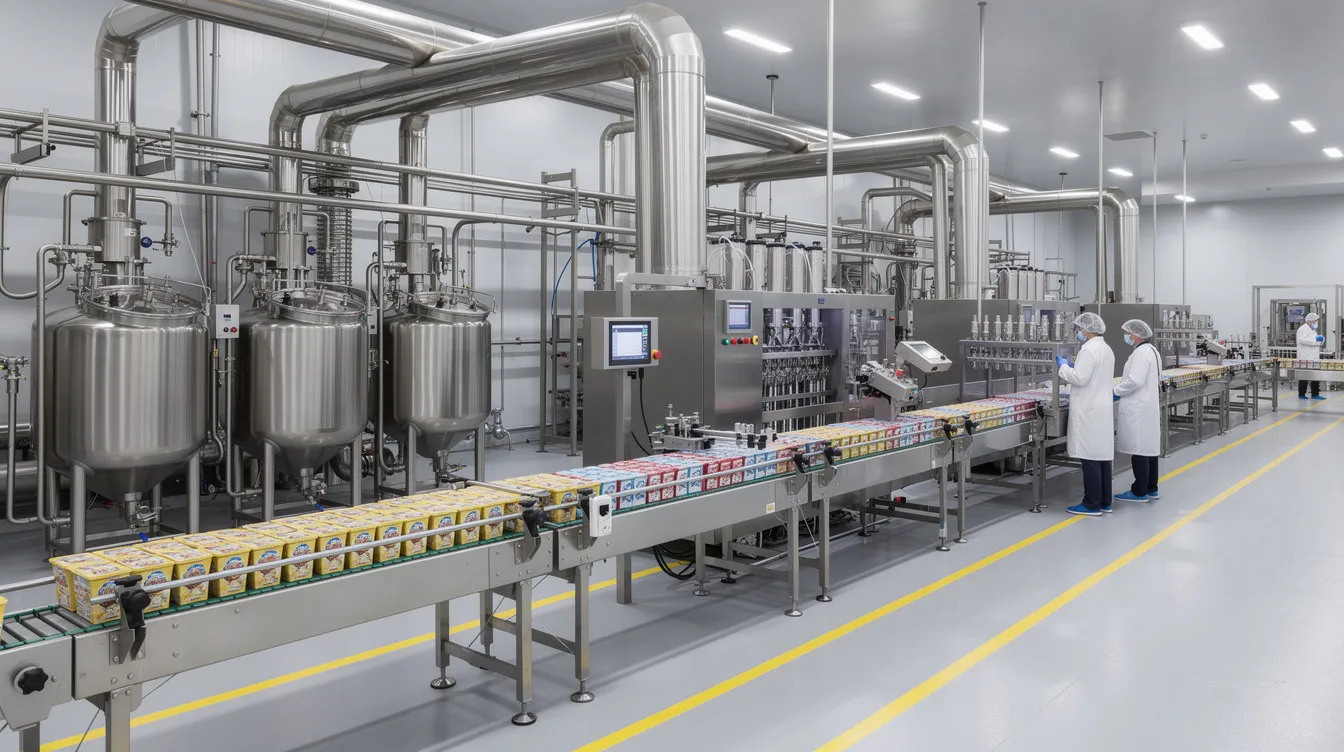
Ice cream production requires specific machinery like pasteurizers and freezers, alongside homogenisers, ageing tanks, and filling lines. Equipment selection must account for current needs and future expansion, and the study should reference detailed guidance on automatic ice cream plant machinery and equipment cost. Efficient supply chain logistics are essential for securing perishable ingredients used in ice cream, and proximity to dairy hubs significantly reduces procurement risk and transport costs.
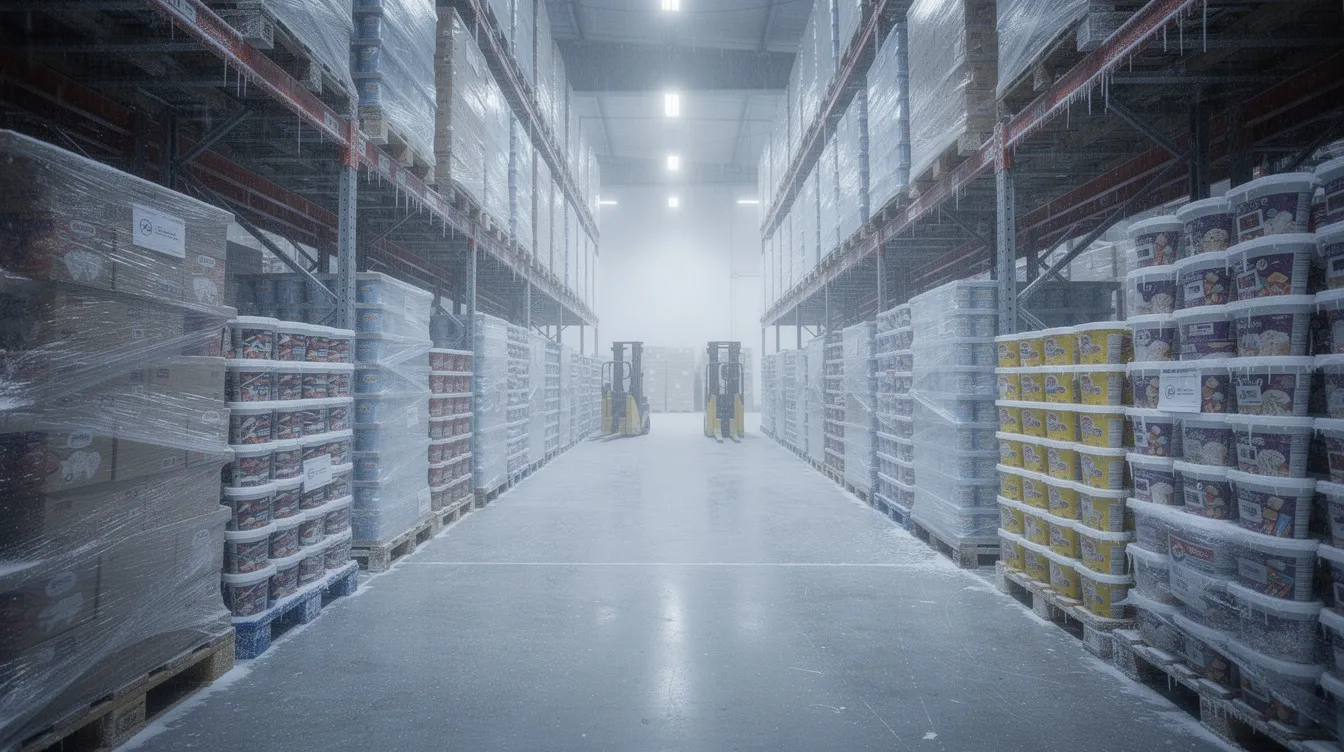
Refrigeration capacity, hardening tunnels and cold-storage space must be aligned with the processing line. If these are undersized, bottlenecks occur even when rated ice cream production capacity is higher. Ice cream manufacturing relies on specialized cold-chain logistics for product distribution, requiring insulated vans, freezer cabinets at retail points and a robust distribution network. Detailed planning for cold storage, refrigeration and hardening tunnel requirements is non-negotiable. For a structured approach to line sizing and product-mix decisions, promoters can refer to the resource on ice cream plant capacity planning and product mix, while the industrial ice cream manufacturing process and production line guide covers the full technology flow.
Project Cost and Means of Finance
Understanding what goes into ice cream plant project cost and how the proposed project is financed is fundamental to financial feasibility. For a plant in the 10,000 to 20,000 LPD range, total investment including working capital typically falls between INR 25 and 60 crore, depending on automation level, cold-chain scope and land costs. Larger plants (20,000 to 25,000 LPD with full automation) may require INR 50 to 90 crore of total funding.
Key cost components include land and site development, factory building and civil construction, process and utility machinery, refrigeration system, hardening tunnel, cold rooms, packaging and material-handling equipment, laboratory and quality-control setup, vehicles including insulated and refrigerated vans, preliminary and pre-operative expenses, interest during construction, contingency and margin for working capital. Machinery and refrigeration together typically constitute 55 to 70% of fixed capital. The setup timeline for an ice cream plant ranges from 12 to 18 months, and delays directly increase interest during construction.
Means of finance typically include promoter’s equity contribution (usually 25–35% of project cost), share capital, unsecured loans from promoters or group companies, term loans from banks or financial institutions, machinery finance, eligible subsidies under food-processing or dairy development schemes, and working-capital facilities such as cash credit and overdraft. In some states, subsidies of up to 35% on eligible plant and machinery are available.
Higher leverage can boost equity returns through financial gearing, but it simultaneously increases cash-flow strain, DSCR risk and vulnerability during lean seasons. Private equity or strategic investors may participate in larger projects, but they will scrutinise the financial model with the same rigour as any lender. A detailed breakdown of ice cream plant project cost and means of finance should anchor every investment discussion.
Financial Projections Required for Ice Cream Plant Feasibility Analysis
Financial projections spanning 7 to 10 years are the backbone of any ice cream plant financial feasibility study and bank appraisal. Financial viability analysis includes assessing capital and operating expenditures for an ice cream plant, but it goes well beyond a single-year profit estimate.
The financial model should include a year-wise capacity utilisation plan (typically starting at 50–55% and rising to 80–85% by Year 4 or 5), product-wise production and sales volumes, selling prices, net realisation after distributor and retailer margins, raw material and packaging consumption, utility costs, manpower cost and selling and distribution expenses.
These inputs must generate linked financial statements: projected profit and loss account, balance sheet, cash-flow statement, fund-flow statement and working-capital assessment. The model should automatically compute break-even analysis, DSCR, ROI, project IRR, equity IRR and NPV based on discounted cash flow analysis. Term-loan repayment schedules, depreciation schedules and interest calculations should be fully integrated with projected cash flows for accuracy. Detailed guidance is available in the resources on financial projections and working capital requirement and bank loan, DSCR and term loan assessment.
Key Revenue and Cost Assumptions in the Ice Cream Plant Financial Model
The assumptions embedded in the financial model materially influence every metric in an ice cream plant profitability analysis. In my experience, the gap between a “viable” and “unviable” projection often comes down to small changes in just three or four assumptions.
Capacity assumptions: Installed capacity, ramp-up trajectory from Year 1 to Year 5, planned shift patterns and seasonal production split between peak and lean periods.
Revenue assumptions: Product mix across cups, cones, sticks, family packs and bulk packs; average selling prices by SKU; distributor and retail margins (which can consume 25–40% of the consumer price); expected annual price revisions; and pricing strategy relative to competition.
Cost assumptions: Raw materials for ice cream include milk, cream, sugar, stabilizers, and emulsifiers, and these materials, especially milk cream, account for 60 to 70% of operating expenses. Operating costs for ice cream plants are driven by raw materials, energy and packaging. Other cost heads include electricity tariffs, refrigeration energy load, labour and management salaries, operator training, repair and maintenance, freight and cold-chain costs, and milk solids procurement during seasonal shortage periods.
Working-capital assumptions: Credit period offered to distributors, inventory holding of finished goods and raw materials, credit available from suppliers, and treatment of GST input credits.
Financing assumptions: Term-loan interest rate, loan tenure, moratorium period, depreciation method and rate, corporate tax rate, and long-term replacement capital expenditure for key equipment.
Every assumption must be supported by real quotations, market discussions, utility bills, wage benchmarks and the promoter’s own strategy. Generic industry averages create a false sense of precision.
Ice Cream Plant ROI Analysis: Concept and Illustrative Example
Return on investment provides a quick measure of whether the money deployed in an industrial ice cream manufacturing project generates an adequate percentage return. The core formula is straightforward:
ROI = (Annual Profit or Cash Return ÷ Total Investment) × 100
Different stakeholders calculate ROI differently. Project ROI typically uses average annual profit before tax or cash accruals divided by total project cost. Return on capital employed focuses on operating profit relative to total capital deployed. Return on equity isolates the profit available to equity shareholders versus their invested capital.
Illustrative example (hypothetical): Suppose total project cost is INR 25 crore and the average annual profit after tax, once the plant stabilises, is INR 3.5 crore. The accounting ROI would be (3.5 ÷ 25) × 100 = 14%. This is purely illustrative and not a norm or a guarantee.
ROI is useful for a quick comparison, but it does not incorporate the time value of money, the construction period, repayment schedule or seasonal cash-flow patterns. Therefore, ROI must always be evaluated together with IRR, NPV, payback period and DSCR to create a complete picture for capital planning and investment decisions.
Ice Cream Plant IRR Calculation and Interpretation
The internal rate of return is the discount rate at which the net present value of all future project cash flows equals zero. In practical terms, IRR reflects the annualised return generated by the investment over its projected life.
There is an important distinction between project IRR (computed on total project cash flows before financing) and equity IRR (computed on cash flows available to equity after interest and loan repayment). Banks typically focus on project IRR to assess overall viability. Promoters and investors care more about equity IRR because it reflects the return on their own money. In the U.S., IRR is commonly used to compare food plant investment projects and rank projects by attractiveness. A good IRR for food plant projects is often in the mid-teens or better, though the threshold depends on risk profile and the company’s hurdle rate.
Illustrative cash-flow pattern: Suppose Year 0 involves an outflow of INR 30 crore for project cost. Years 1 through 10 generate net cash inflows rising from INR 2 crore in Year 1 to INR 6 crore in Year 5 and stabilising thereafter. The IRR can be computed in Excel using the IRR or XIRR functions on this cash-flow series. In this illustrative example, the project IRR might fall in the range of 13–17%, depending on exact year-wise figures.
Debt financing can increase equity IRR through leverage – if borrowed funds earn a return above the interest rate, the surplus accrues to equity. However, this magnification works in both directions: if operations underperform, equity IRR drops sharply and repayment pressure rises. Common pitfalls that inflate the apparent IRR include unrealistic ramp-up assumptions, ignoring major overhauls or replacement capital expenditure, and excluding working-capital changes. The traditional IRR method also assumes that intermediate cash flows are reinvested at the same rate as the IRR itself, which may be unrealistic for very high computed rates. The modified internal rate of return addresses this by assuming reinvestment at a more conservative rate. When promoters need to compare projects – say, an ice cream plant (Project A) against a dairy processing plant (Project B) – both IRR and NPV should be computed side by side.
Net Present Value (NPV) and Its Role in Ice Cream Manufacturing Project Viability
Net present value is the sum of the present values of all future cash inflows minus the initial investment, calculated using a selected discount rate. The discount rate typically reflects the cost of capital or the investor’s required rate of return. If the NPV is positive, the projected returns exceed the discount rate, and the ice cream project creates value. If NPV is negative, the project destroys value at that rate.
Conceptually, the calculation involves discounting each year’s net cash inflow back to Year 0 using present value factors derived from the chosen discount rate, then subtracting the initial outflow. For example, if INR 30 crore is invested at Year 0, and the present value of net cash inflows over 10 years at a 13% discount rate totals INR 35 crore, the NPV is INR 5 crore – a positive outcome. This is purely illustrative.
NPV is often more important than IRR for value creation in projects because it provides an absolute rupee figure of value created, not just a percentage. A project with a larger NPV may be preferable even if its IRR is slightly lower than an alternative, because it generates more total wealth. The relationship between IRR and NPV is direct: IRR is the rate at which NPV becomes zero. At any discount rate below the IRR, NPV is positive; above the IRR, NPV turns negative. For decision makers weighing investment opportunities, NPV at a realistic discount rate provides the clearest answer on value creation.
Payback Period of an Ice Cream Manufacturing Plant
The payback period is the time taken for cumulative cash inflows from operations to recover the initial investment in the ice cream plant. It is a simple, intuitive measure of how long the promoter’s money remains at risk.
Simple payback ignores discounting and merely adds up annual cash surpluses until they equal the total project cost. Discounted payback applies present value factors to each year’s cash flow before cumulating, providing a more conservative and realistic recovery timeline. Many lenders and investors prefer to see at least the discounted figure.
Illustrative example: If a project costs INR 25 crore and generates net cash accruals averaging INR 4–5 crore per year once stabilised, simple payback may occur around Year 5 or 6. With discounting, recovery typically extends by one to two additional years. Break-even for ice cream manufacturing typically ranges from 3 to 5 years in terms of operating profit, but full capital recovery takes longer.
Seasonal cash flows, gradual capacity utilisation in initial years and working-capital requirements can delay practical payback significantly beyond what a simple annual average suggests. Payback period should never be the sole viability criterion; it must be evaluated alongside IRR, NPV, DSCR and the long-term competitive position of the ice cream plant.
Profitability and Break-Even Analysis for Ice Cream Plants
Profitability analysis for an ice cream project centres on understanding contribution per litre or kilogram, the structure of fixed and variable costs, and the margin of safety between break-even capacity and normal operating capacity.
Ice cream manufacturing plants typically have gross profit margins of 40 to 50%, though net margins are substantially lower after accounting for depreciation, interest, distribution, wastage and overheads. Overrun directly affects ice cream yield economics and profitability; higher overrun increases volume output from the same mix weight, improving contribution per litre. A yield improvement of even a few percentage points can materially shift break-even volumes.
Break-even capacity utilisation is the level at which total revenue exactly covers total costs, leaving zero profit. The normal operating capacity should be significantly above break-even – for example, if break-even is at 45–50% capacity utilisation, the plant should target 70–80% under normal conditions to provide a cushion against weak seasons, pricing pressure or cost increases.
Higher-margin SKUs such as premium products, specialty packs and novelty items improve contribution and lower the overall break-even point. A plant operating close to break-even has limited ability to absorb lower demand, higher raw-material prices or operational disruptions. Detailed treatment is available in the resource on ice cream plant profitability and break-even analysis.
DSCR and Loan Repayment Capacity of the Ice Cream Project
The Debt Service Coverage Ratio measures whether operating cash flows are sufficient to meet principal and interest obligations in a given period. It is the single most important metric for lenders evaluating a term-loan proposal for an industrial ice cream plant.
Banks in India examine both year-wise DSCR and average DSCR over the loan tenure. A year-wise DSCR below 1.0 means the project cannot meet its debt obligations from operations in that year, which is a serious red flag. Even if the average DSCR over the full tenure is acceptable, a sustained dip in the early years – common when capacity utilisation is still ramping up – can trigger concern.
Moratorium period, loan tenure, interest rate and repayment structure all interact with seasonal cash flows from ice cream manufacturing. A structured repayment plan with lower instalments in initial years and higher instalments later may better match the cash-flow profile. However, lenders will stress-test whether the project can handle higher interest rates or slower ramp-up.
Common issues include low DSCR during the first two years, heavy interest burden, and excessive promoter drawings that reduce cash available for debt servicing. These may require restructuring of loan tenure, project phasing or additional equity infusion. The dedicated guide on bank loan, DSCR and term loan assessment covers these dynamics in greater depth.
Ice Cream Plant Sensitivity Analysis: Testing Project Robustness
Sensitivity analysis is the systematic testing of how changes in key assumptions affect profitability, cash flows, DSCR, IRR and NPV. For an ice cream project, this analysis is particularly important due to seasonality, dependence on cold-chain performance and exposure to dairy commodity price cycles.
Typical scenarios I test in practice include:
- 10–15% drop in sales volume below the base case
- Delay in reaching target capacity utilisation by one or two seasons
- 5–10% increase in milk and cream procurement prices
- Rise in sugar, packaging and utility costs
- 1–2% increase in term-loan interest rate
- 10–15% overrun in project capital cost
- Extended debtor days stretching the working-capital cycle
Each scenario can be summarised in a sensitivity table. The following is purely illustrative:
| Scenario | Assumption Change | Impact on EBITDA | Impact on DSCR | Impact on Project IRR |
|---|---|---|---|---|
| Sales volume drop | –15% | –20 to –25% | Falls below 1.2× | Drops 3–4 percentage points |
| Milk price increase | +10% | –12 to –15% | Falls by 0.15–0.20× | Drops 1.5–2.5 percentage points |
| Interest rate rise | +2% | No direct change | Falls by 0.10–0.15× | Drops 1–1.5 percentage points |
| Project cost overrun | +15% | No change in operations | Falls due to higher debt service | Drops 2–3 percentage points |
| Capacity delay by 1 year | Ramp-up shifts by 12 months | Significant in early years | May breach 1.0× in Year 2 | Drops 2–4 percentage points |
All figures above are illustrative only and do not represent any specific project.
In my practice, I look for whether the project remains DSCR-positive and cash-flow stable under reasonable adverse scenarios, not just in the base case. A project that turns negative cash flows under a modest 10–15% sales shortfall needs fundamental re-examination of its cost structure or financing.
Scenario Analysis: Base, Optimistic and Adverse Cases
While single-variable sensitivity analysis tests one assumption at a time, multi-variable scenario analysis examines the combined effect of several assumptions changing simultaneously – a more realistic representation of how business conditions evolve.
The Base Case should use realistic assumptions for capacity utilisation (for example, 50–55% in Year 1 rising to 80–85% by Year 5), selling prices based on current market evidence, and raw-material costs reflecting recent procurement quotes. This is the most probable operating scenario and forms the foundation for loan appraisal.
The Optimistic Case may assume slightly better selling prices, faster capacity ramp-up, improved contribution margins or lower wastage, but the assumptions must remain cautious and supportable. Overly aggressive optimistic cases undermine the credibility of the entire feasibility report.
The Adverse Case should model delayed market penetration, weaker pricing power, higher milk and energy costs, extended debtor days and perhaps a 6 to 12 month delay in project completion. A financially resilient ice cream manufacturing project should remain operationally viable and capable of servicing debt even in a reasonable adverse case, although promoter returns may be materially lower. Execution risk – the chance that the project is completed late, over budget or with operational teething problems – should be factored into the adverse scenario.
Major Risks Affecting Ice Cream Manufacturing Project Viability
Every ice cream project carries risks that can derail even well-prepared financial projections. A rigorous ice cream manufacturing project risk analysis should function as a risk register with practical mitigation strategies.
Market and operational risks: Seasonal demand dependence means positive cash flows concentrate in summer months and negative cash flows can occur in lean periods. Aggressive competition and price wars from national and regional players can erode margins. Volatility in milk, cream and sugar prices directly affects variable costs. Energy cost hikes and power cuts can disrupt production and spoil inventory. Refrigeration or cold-room failures can destroy product worth lakhs in hours. Product spoilage and quality issues damage brand trust and create financial losses. Quality control measures include microbiological testing and allergen management protocols to prevent recalls and maintain consumer confidence.
Financial and execution risks: Working-capital shortages during peak season can prevent a company from scaling production when demand is highest. Higher-than-budgeted project cost is common, especially when civil works or imported equipment is involved. Implementation delays beyond 12 to 18 months increase interest during construction and defer revenue. Over-reliance on debt leaves no buffer for underperformance.
Mitigation approaches: Long-term milk procurement arrangements reduce commodity price exposure. Backup power through diesel generator sets and maintenance contracts for refrigeration equipment address cold-chain reliability. Phased capacity ramp-up and conservative debt-equity structures reduce financial fragility. Adequate working-capital lines must be sanctioned before the plant starts operations.
Regulatory and food safety risks: Regulatory compliance involves securing food safety licenses and adhering to quality standards under FSSAI, HACCP and other applicable frameworks. Non-compliance can lead to product recalls, brand damage and legal consequences.
How Banks and Investors Evaluate an Industrial Ice Cream Plant Proposal
Indian banks, NBFCs and investors review an ice cream plant DPR and financial model through a structured appraisal process before approving term loans or equity investment. Understanding their perspective helps promoters prepare stronger proposals.
Evaluation begins with the promoter’s profile – experience in dairy or food processing, track record with similar projects, financial standing and credibility. Lenders examine the clarity of market strategy, the realism of project cost based on actual machinery quotations, the promoter’s capital contribution (typically 25–35% of project cost) and the security or collateral offered.
On the financial side, lenders review projected profitability, cash accruals, break-even point, average and minimum DSCR, project IRR, NPV and the project’s robustness under sensitivity scenarios. Overstated sales projections, very thin margins, aggressive capacity assumptions or inadequate promoter contribution are major red flags even if the calculated IRR seems attractive. An apparently viable project that falls apart under modest adverse assumptions will not inspire confidence.
A professional, data-backed and internally consistent feasibility report significantly improves the quality of lender discussions, though it does not guarantee loan sanction. The benefits of thorough preparation extend beyond the bank – they force the promoter to confront realistic economics before committing capital.
When Is an Ice Cream Plant Financially Feasible?
Rather than prescribing universal numeric benchmarks, I present financial feasibility as a qualitative decision framework, because thresholds differ among lenders, investors and project types.
A project may be considered financially feasible when market demand is reasonably established through credible research, installed capacity matches the distribution plan, project cost is supported by reliable quotations, capacity utilisation assumptions are achievable within the proposed timeline, and operating margins provide an adequate cushion above break-even. Cash flows must support debt repayment, with average and annual DSCR remaining acceptable to the lender throughout the tenure. Project IRR should exceed the cost of capital, and NPV should remain positive at a realistic discount rate.
Critically, sensitivity and scenario analysis must show that the project can withstand moderate adverse movements in sales, price or cost without immediate default or severe cash-flow stress. The final feasibility judgement must be project-specific, taking into account the promoter’s risk appetite, available collateral, alternative investment opportunities and long-term strategic plans for the business, including capacity expansion over time. The process of determining feasibility is not a one-time exercise; it evolves with new projects and changing market conditions.
Importance of a Customised, Bankable DPR for an Ice Cream Plant
Generic or off-the-shelf project reports for ice cream production are risky for medium and large investments. They seldom reflect actual capacity, product mix, location-specific costs or the proposed financing structure. A ready-made report might suggest returns that do not hold when real quotations, local power tariffs and regional labour costs are plugged in.
A customised, bankable ice cream plant DPR should include detailed technical configuration, machinery quotations from identified suppliers, construction and utility cost estimates, a realistic implementation schedule, a staffing plan with provision for operator training, and comprehensive financial projections. It must tie together location-specific aspects like electricity tariffs, distance to raw material sources and target markets, and region-specific seasonality patterns that determine when money comes in and when it goes out.
In my practice, I assist promoters by preparing detailed feasibility reports, CMA data, financial projections and bank documentation. The objective is always to create an internally consistent model where assumptions are transparent and traceable, enabling the promoter and lender to have an informed conversation. Projections are estimates based on inputs provided and prevailing conditions – they are not guaranteed outcomes. Interested promoters can explore related resources on industrial ice cream plant setup cost and automatic ice cream plant machinery and equipment cost for further context.

Frequently Asked Questions on Ice Cream Plant Feasibility, ROI and IRR
The following questions are frequently raised by entrepreneurs, dairy companies and investors planning industrial ice cream plants. Answers are general in nature; actual figures must be developed from a customised feasibility report and financial model reflecting project-specific conditions.
Is an industrial ice cream manufacturing plant generally profitable in India?
Industrial ice cream plants can be profitable when they achieve sufficient scale, maintain strong distribution networks, control raw material and cold-chain costs, and focus on a disciplined product mix. Ice cream manufacturing plants typically achieve gross profit margins of 40 to 50%, but net margins are significantly lower after interest, depreciation, distribution costs and overheads. Profitability is not automatic – it depends on execution quality, competitive dynamics, cost control and the ability to maintain adequate capacity utilisation across seasons.
What information do you need from a promoter to prepare a customised feasibility report?
Key inputs include the proposed location and land status, target capacity in LPD, intended product range and SKU mix, target markets and distribution plans, preferred machinery brands or technology level, approximate investment budget, planned debt-equity structure, existing banking relationships, and the expected timeline for implementation. The more precise and realistic these inputs, the more useful the resulting financial model will be for finance and investment decisions.
How long does it usually take to prepare a detailed bankable DPR for an ice cream plant?
For a typical 5,000 to 20,000 LPD project, a detailed DPR generally takes 3 to 6 weeks, depending on the availability of machinery quotations, site details, promoter inputs and the level of detailing required by the lending institution. Complex, multi-line projects or those requiring detailed environmental or regulatory analysis may take longer.
Can an ice cream plant remain viable if capacity utilisation stays low for several years?
Moderate under-utilisation in initial years is normal and expected in most project appraisals. However, prolonged low utilisation significantly affects ROI, IRR, DSCR and payback period. Viability under sustained low capacity depends on the fixed-cost structure, the ability to secure institutional sales or contract manufacturing arrangements, management of working capital, and whether the finance structure provides adequate breathing room. A high fixed-cost base combined with low utilisation is one of the fastest ways to erode project viability.
How does food safety certification affect the financial feasibility of an ice cream factory?
Strong food safety systems – FSSAI compliance, HACCP certification, regular microbiological testing, hygienic plant design – increase both initial capital expenditure and ongoing operating expenses. However, these systems reduce the risk of product recalls and regulatory penalties, improve acceptance among institutional buyers and modern retail chains, and support premium pricing. Indirectly, robust food safety practices enhance long-term profitability and project viability by protecting brand reputation and enabling access to higher-value channels.
Conclusion and Professional Call to Action
An ice cream plant feasibility study must integrate market assessment, technical design, detailed project cost estimation, robust financial projections and thorough ROI, IRR, NPV, DSCR and sensitivity analysis. No single metric tells the full story. A high projected IRR means little if the underlying sales assumptions are unrealistic, and a short payback period loses its appeal if the project cannot service debt during seasonal troughs.
Promoters and investors should examine cash flows, repayment capacity, break-even position and resilience under adverse scenarios before committing substantial capital. The feasibility study is not a formality for the bank file – it is the analytical foundation on which the entire investment decision rests.
If you are a serious promoter, dairy company, investor or consultant planning an industrial ice cream manufacturing plant in India, I invite you to engage through www.projectreportbank.com for customised DPRs, feasibility reports, financial projections, ROI and IRR analysis, CMA data preparation and bank-finance documentation. Every engagement is tailored to the specific project, and all projections are prepared with professional care based on inputs provided and prevailing conditions.
Disclaimer: The information in this article is for general guidance and educational purposes. Financial results depend on actual market conditions, operating performance, execution quality and numerous project-specific factors. No guarantee of profitability, specific returns or bank-loan approval is expressed or implied. All numerical examples are purely illustrative.
- CA Manish Gugliya