
Key Takeaways
- Industrial ice cream plant profitability depends on realistic net sales realisation, product mix, capacity utilisation, cold chain logistics costs and seasonal demand fluctuations – not merely on production volume.
- Higher ice cream sales alone do not ensure profit; contribution per litre and fixed-cost coverage are the core tests for any ice cream manufacturing business.
- Promoters must distinguish among gross profit, contribution, EBITDA, PAT and cash profit when assessing project viability and repayment capacity in their financial projections.
- This article provides step-by-step break-even formulas, an illustrative numerical example and guidance on scenario analysis, seasonality and product-wise profitability for DPR preparation and bank appraisal.
- Content is focused exclusively on industrial, automatic plants – not ice cream parlor operations, ice cream shop formats or micro-scale businesses – and reflects the advisory experience of CA Manish Gugliya.
Introduction: Ice Cream Plant Profitability and Break-Even Analysis in Practice
In the ice cream industry – a segment within a global ice cream market valued at USD 78.57 billion in 2025 – rising production or dispatches do not automatically translate into higher profit. What determines ice cream plant profitability is net realisation per litre, capacity utilisation, cost structure and disciplined cash-flow management.
An automatic, high-capacity ice cream manufacturing plant requires substantial capital investment in ice cream equipment, refrigeration, cold chain infrastructure and staffing. These fixed costs persist regardless of output. Profitability emerges only when the contribution earned per litre of saleable ice cream products, multiplied by actual volumes, exceeds total fixed operating costs for the period.
Break-even analysis identifies exactly that threshold – the production or sales level at which total contribution covers fixed costs, resulting in zero operating profit. This article, written from my advisory practice as CA Manish Gugliya, FCA, DISA (ICAI), guides entrepreneurs, investors and bankers through the practical financial analysis required for an industrial ice cream manufacturing project.
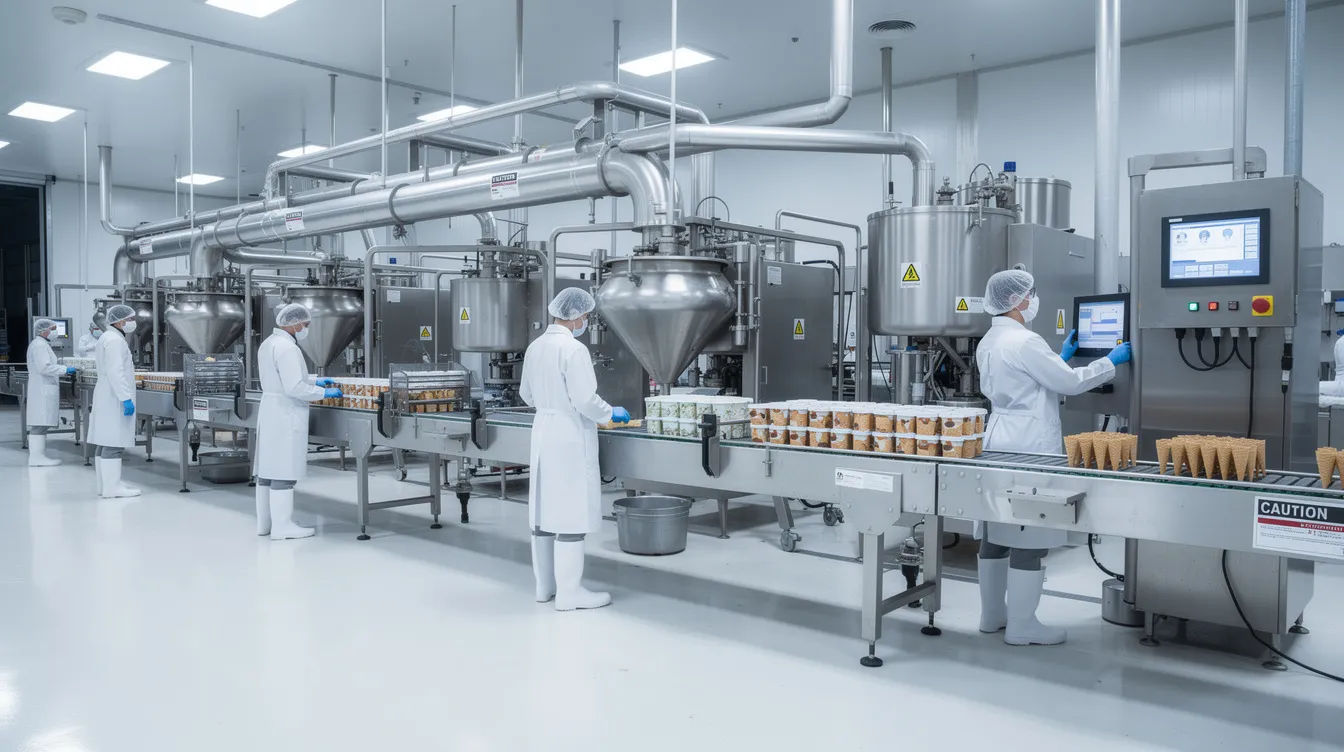
Understanding Ice Cream Plant Profitability: From Gross Margin to Cash Profit
Profitability for an industrial ice cream business means the ability to generate sustainable cash surplus after meeting all operating costs, depreciation, interest and taxes over the plant’s economic life.
Profit margins for ice cream products can range from 40% to 75% depending on scale and format. However, the relevant metric varies by stakeholder. Gross profit (net sales minus production costs including milk, cream, sugar and utilities) gives a manufacturing-level view. Contribution (net sales minus only variable costs) reveals the surplus available to cover fixed costs. EBITDA strips out depreciation and interest, showing operating cash generation. EBIT deducts depreciation. PBT accounts for finance cost. PAT reflects the post-tax position. Cash profit adds back non-cash depreciation to PAT.
Gross profit margins for industrial ice cream facilities typically range between 40% and 50%. But a plant showing positive gross margin can still face cash losses once administrative overheads, heavy depreciation on ice cream machines and finance costs are accounted for. Lenders focus on EBITDA, cash accrual and DSCR – not just headline margins. Every ice cream factory profit analysis must link these metrics back to realistic production capacity, market demand and financing structure.
Major Drivers of Industrial Ice Cream Plant Profitability
Ice cream plant profitability in India and globally is shaped by several factors working together: net realisation, capacity utilisation, product mix, raw materials, energy and distribution. Each driver directly affects contribution per litre and total profit.
Net Sales Realisation. The right price for the manufacturer is never the MRP printed on the pack. Net realisation shrinks after distributor margins (often 10–25%), trade discounts, promotional schemes, sales returns, damaged or expired stock write-offs, freezer-placement support and freight contributions. Building a strong ice cream brand identity can justify a higher price point, but ice cream plant cost and profit calculations must always use conservative net realisation. Analyzing consumer preferences across age groups and foodservice channels is essential to setting realistic pricing.
Capacity Utilisation. Capacity utilization is a primary determinant of unit economics due to high fixed costs. Installed capacity differs from practical operating capacity (adjusted for maintenance, shift availability, hardening bottlenecks) and from actual saleable production (after losses and returns). A plant at 50% utilisation absorbs twice the fixed cost per litre compared to one running at full capacity. Seasonal patterns matter – peak months may see 80–90% utilisation while off-season drops to 30–40%. Economies of scale lower the cost per unit by spreading fixed costs over more product.
Product Mix. Cups, cones, sticks, family packs, institutional tubs, premium ice cream, premium frozen desserts, seasonal flavors, sugar free variants and new flavors each have different contribution profiles. A premium stick with chocolate coating may yield high margin per unit but lower volumes. Institutional tubs offer volume but thinner margins. Soft serve ice cream lines and batch freezer output may serve different channels. Overrun (air incorporation) is essential to manage: too little increases production costs while too much reduces consistent quality. Analyzing consumer trends across convenience stores, local schools, export markets and dessert sales channels guides the optimal mix. Recipe development for each SKU must balance high quality ingredients with cost control. Weighted-average contribution across the product mix determines the real ice cream manufacturing profit margin.
Raw Materials and Packaging. Raw materials are usually the largest cost component, with ingredient costs typically constituting 60% to 70% of total operating costs. Key ingredients include milk (costing $0.70–$0.80 per litre, or £0.80 to £1.20 per litre depending on market), cream ($3.50–$4.00 per litre), sugar ($0.50 per kilogram), stabilisers, emulsifiers, flavours and inclusions. Fruit can cost from £1.50 to £5 per kilogram. Additives like nuts or chocolate further increase ice cream production costs. The cost of dairy inputs like milk and cream is highly volatile, sourced from dairy farmers whose pricing fluctuates seasonally. Reliable suppliers and long-term procurement contracts can stabilise costs. Packaging expenses – cups, cones, sticks, wrappers, cartons and filling machines for packaging – significantly affect unit economics and must be factored into direct production costs. Monitoring yield and waste during the production process is critical as they directly impact profitability.
Energy, Refrigeration and Cold Chain. Ice cream manufacturing and storage are exceptionally energy-intensive processes. Ice cream production requires high-capacity and uninterrupted power supplies for refrigeration processes including heat treatment through a milk pasteurizer, homogenisation, continuous freezing, hardening tunnels and cold rooms. Utility costs generally account for 15% to 20% of operating expenses. Electricity for pasteurising 100 litres costs approximately £1.25 to £2.50. Diesel-generator backup, CIP operations and refrigeration units for storage add further operational costs. Implementing energy-efficient systems can significantly lower electricity costs during freezing and hardening. These estimates must be based on plant-specific technical data covering unit operations, not generic assumptions.
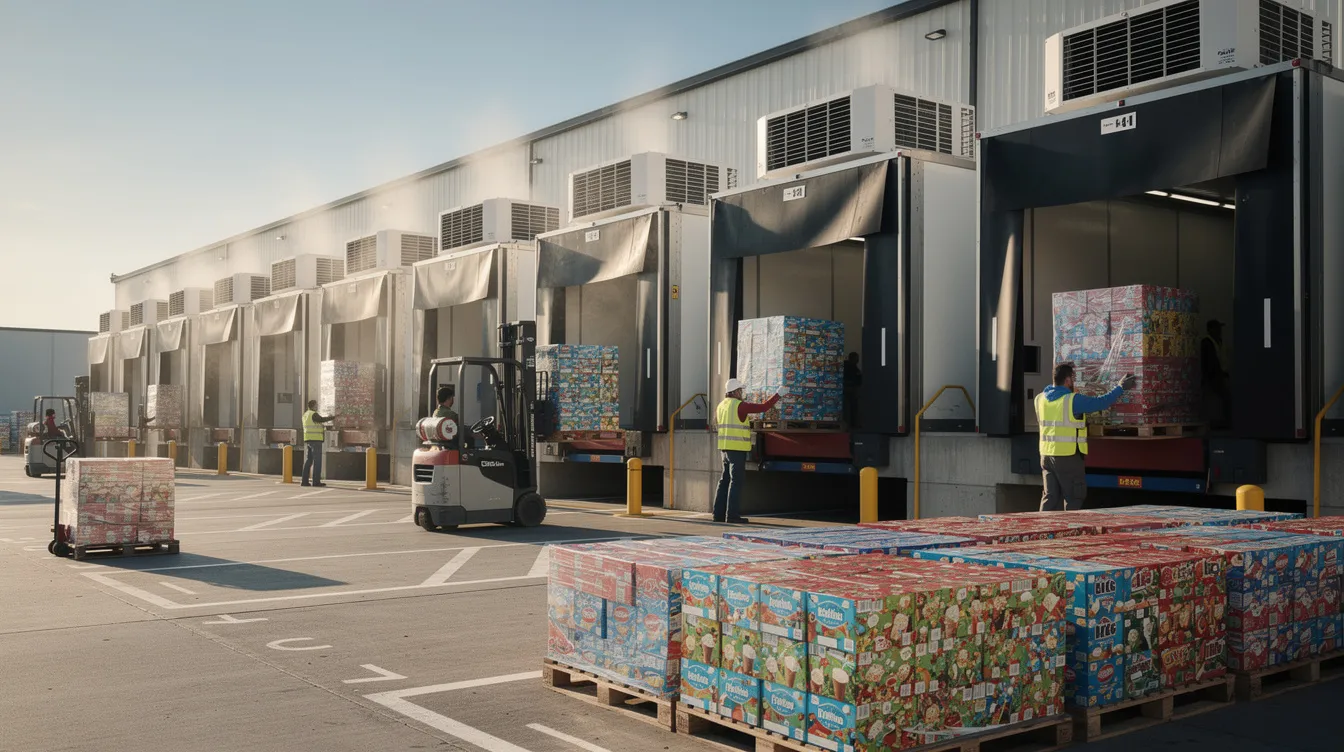
Distribution and Seasonality. Demand for ice cream is heavily weather-dependent and seasonal, peaking during warmer months. Maintaining sub-zero temperatures throughout the cold chain logistics chain is essential to prevent spoilage. Ice cream display cabinets are necessary at retail points. Effective cold-chain logistics can significantly impact profitability by preventing product loss. Distribution costs include refrigerated vehicles, depot storage, freezer placement and route expenses. A marketing plan aligned with seasonal peaks, along with efforts to attract customers during lean months, strongly affects industrial ice cream plant profitability. Proper management of supply chain dynamics is critical.
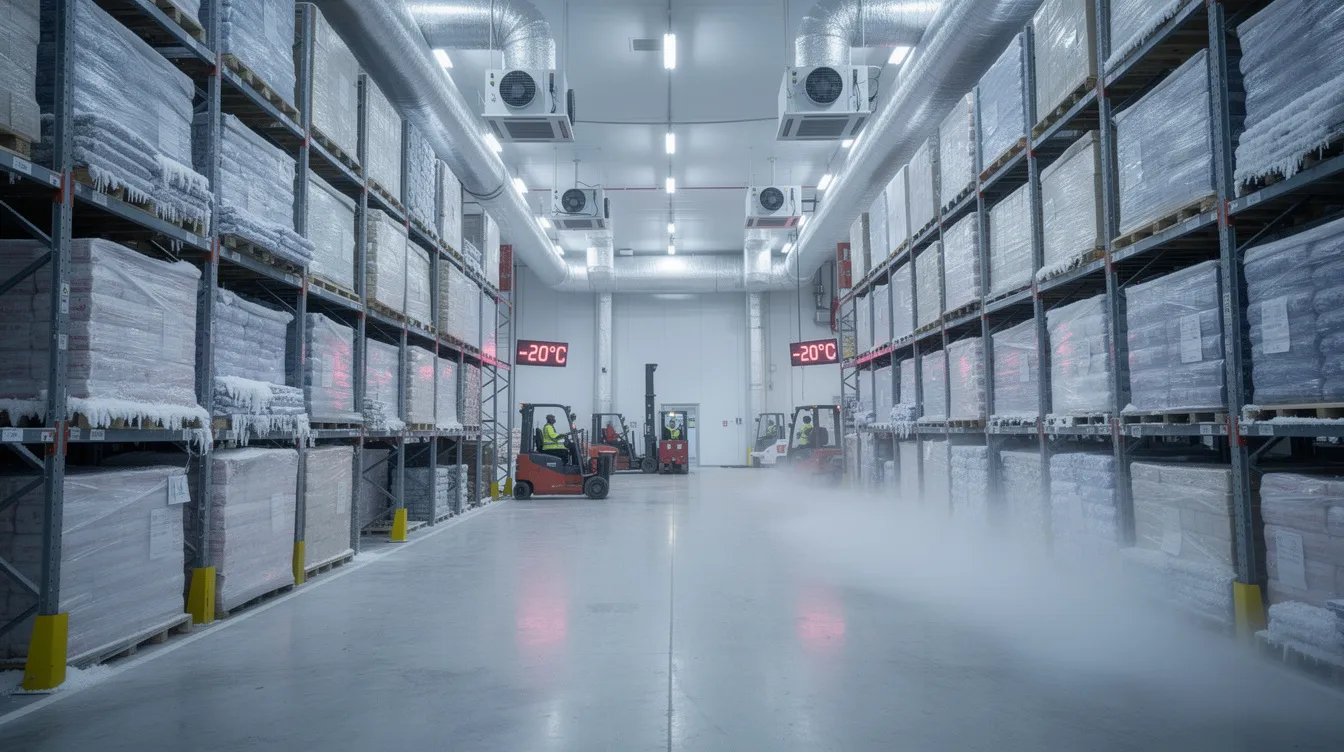
Fixed, Variable and Semi-Variable Costs in an Ice Cream Manufacturing Business
Correct classification of ice cream plant fixed and variable costs is essential for accurate contribution and break-even analysis. The table below summarises typical behaviour within a normal production range:
| Cost Item | Classification | Behaviour with Production | Important Qualification |
|---|---|---|---|
| Raw materials (milk, cream, sugar etc.) | Variable | Proportional to saleable litres | Quality specs and recipe affect cost per litre |
| Primary packaging (cups, cones, sticks) | Variable | Proportional to SKU volume | Imported vs local; filling machines needed |
| Secondary packaging / cartons | Variable | Grows with batches shipped | Reusable options available |
| Production power | Semi-variable | Scales with run-hours and load | Base load always present |
| Refrigeration and cold storage | Semi-variable | Fixed base plus variable overhead | Cold rooms incur cost even when idle off-season |
| Factory salaries and wages | Fixed | Stable within normal volume range | Extra shifts trigger step increases; employee salaries may range from $150 to $250 per month at entry level |
| Repairs and maintenance | Semi-variable | Increases with usage and equipment age | Preventive vs capital overhaul distinction |
| Quality control and lab costs | Semi-variable | More tests with more SKUs/flavours | Compliance with food safety standards by local authorities requires ongoing testing |
| Refrigerated freight | Variable | Scales with distance and frequency | Own fleet vs third-party cold chain |
| Distribution commission | Variable | Proportional to volume or sales | Institutional vs dealer contracts differ |
| Sales and promotional expenses | Semi-variable | Linked to campaigns and season | Heavier during launch and peak |
| Factory rent / depreciation | Fixed | Does not vary with production | Rent for a 40 m² office area may be about $200 per month; depreciation is non-cash |
| Administrative expenses | Fixed | Broadly constant | Staff training costs included |
| Insurance | Fixed | Annual premium unchanged short-term | May rise with asset or inventory base |
| Depreciation (machinery/plant) | Fixed (non-cash) | Charged regardless of utilisation | Ice cream machines are a major expense for production |
| Interest on term loan | Fixed | Scheduled regardless of output | Variable-rate loans introduce some variability |
| Working-capital interest | Semi-variable | Linked to inventory and receivable cycle | Higher in peak season |
Some expenses shift classification depending on the plant’s business model, contractual arrangements and production range. These classifications must remain consistent across the DPR, CMA Data and financial statements.
Contribution and Unit Economics for an Ice Cream Factory
Contribution is the central profitability lens for an industrial ice cream plant. It measures what remains from each litre sold after covering variable costs – the surplus available to absorb fixed costs and generate profit.
The core formulas are:
- Contribution per unit = Net selling price per unit − Variable cost per unit
- Total contribution = Net sales − Total variable cost
- Contribution margin ratio (P/V ratio) = (Contribution ÷ Net sales) × 100
Net selling price must reflect actual net sales realisation, not the printed retail selling price. Where multiple SKUs are manufactured, a weighted-average contribution per litre or per kilogram provides a realistic ice cream plant contribution margin. Changes in raw-material prices, packaging or distribution incentives directly shift this margin. Tracking your gross margin per batch is vital for understanding profitability in ice cream production.
Ice Cream Plant Break-Even Analysis: Formulas and Interpretation
Break-even analysis answers a fundamental question: at what sales level does the plant’s total contribution exactly cover its fixed operating costs?
Key formulas:
- Break-even sales value = Fixed cost ÷ Contribution margin ratio (expressed as decimal)
- Break-even quantity = Fixed cost ÷ Contribution per unit
- Break-even capacity percentage = Break-even production quantity ÷ Practical annual capacity × 100
- Margin of safety = Actual or projected sales − Break-even sales
- Margin of safety percentage = (Margin of safety ÷ Actual or projected sales) × 100
A narrow margin of safety signals vulnerability to even small drops in volume or realisation. Promoters and lenders should evaluate whether projected capacity utilisation leaves adequate cushion above the ice cream plant break-even point, particularly given seasonal volatility in ice cream sales.
Accounting, Operating, Cash and Debt-Service Break-Even
In a capital-intensive ice cream manufacturing project, break-even has multiple perspectives. Accounting break-even targets PBT = 0 after depreciation and interest. Operating break-even looks at EBIT = 0 – contribution covering fixed costs plus depreciation but excluding finance cost. Cash break-even measures the sales level where cash inflows cover all cash operating costs and interest, ignoring non-cash depreciation. Debt-service break-even is the strictest: cash accrual must cover scheduled principal plus interest, tested via DSCR in bank appraisals.
Break-even for ice cream manufacturing typically ranges from 3 to 5 years. However, break-even analysis alone is never sufficient. It must be supplemented by detailed cash-flow projections and DSCR analysis before lenders consider sanctioning term loans or working-capital limits.
Illustrative Break-Even Calculation for an Industrial Ice Cream Plant
Disclaimer: The figures below are illustrative assumptions used only to explain the calculation method. They are not industry benchmarks, quotations or assured financial results. Actual results vary with plant size, right location, technology, product mix, market reach and operating efficiency.
Assumptions:
- Practical annual capacity: 60,00,000 litres (20,000 LPD × 300 operating days)
- Year-1 utilisation: 60% → Saleable production: 36,00,000 litres
- Net realisation per litre: ₹150
- Variable cost per litre: ₹90
- Total annual fixed operating cost: ₹7.00 crore
Calculation:
- Contribution per litre = ₹150 − ₹90 = ₹60
- Contribution margin ratio = 60 ÷ 150 = 0.40 (40%)
- Total contribution = 36,00,000 × ₹60 = ₹21.60 crore
- Break-even quantity = ₹7,00,00,000 ÷ ₹60 = 11,66,667 litres
- Break-even sales value = ₹7,00,00,000 ÷ 0.40 = ₹17.50 crore
- Break-even capacity utilisation = 11,66,667 ÷ 60,00,000 = 19.4%
- Margin of safety = ₹54.00 crore − ₹17.50 crore = ₹36.50 crore
- Margin of safety % = 36.50 ÷ 54.00 × 100 = 67.6%
Note: This example excludes depreciation and interest from fixed costs for simplicity. Including them would raise the accounting break-even threshold. Evaluating profitability involves analyzing capital expenditures and seasonal demand fluctuations beyond this static calculation.
Profitability Statement Format for an Ice Cream Manufacturing Project
A structured projected P&L helps promoters, investors and banks evaluate ice cream manufacturing project viability:
| Particulars | Calculation Basis |
|---|---|
| Gross sales | Volume × selling price |
| Less: discounts, returns | Plant-specific assumptions |
| Net sales | Gross sales less deductions |
| Variable production cost | Saleable volume × variable cost per litre |
| Contribution | Net sales less variable cost |
| Fixed operating expenses | Detailed cost estimates |
| EBITDA | Contribution less fixed operating expenses |
| Depreciation | Based on eligible fixed assets |
| EBIT | EBITDA less depreciation |
| Finance cost | Based on proposed borrowing |
| Profit before tax | EBIT less finance cost |
| Tax | As applicable |
| Profit after tax | PBT less tax |
| Cash profit | PAT plus depreciation |
These assumptions must remain consistent with the project’s technical specifications on industrial ice cream plant setup cost in India and all supporting documents.
Capacity Utilisation, Scenario Analysis and Step-Fixed Costs
Banks expect conservative, base and optimistic scenarios for ice cream plant financial projections, not a single-case estimate:
| Scenario | Utilisation | Saleable Volume | Net Sales | Contribution | Fixed Costs | EBITDA | BE Status | Margin of Safety |
|---|---|---|---|---|---|---|---|---|
| Conservative | 50% | Lower | Lower | Lower | Stable | Thin/Negative | Near/Below | Low |
| Base | 70% | Moderate | Moderate | Moderate | Stable | Positive | Above | Moderate |
| Optimistic | 85%+ | Higher | Higher | Higher | May step up | Strong | Well above | High |
Within a limited band, fixed costs remain constant while variable costs grow, improving profitability beyond break-even. But step-fixed costs – an additional shift, extra cold storage, new distribution routes, staff training requirements – cause fixed costs to jump at certain thresholds.
Promoters should review automatic ice cream plant machinery and equipment cost and ice cream plant project cost and means of finance when planning phased expansion against these scenarios. Even moderate capital investment in debottlenecking can shift project economics significantly.
Effect of Seasonality on Ice Cream Plant Break-Even and Cash Flow
While the annual ice cream plant break-even point may appear comfortable, monthly cash flows can be severely strained. Seasonal dips in ice cream sales necessitate effective cash flow management strategies.
Production ramps up before summer, creating finished-goods inventory in cold stores and blocking working capital in stock and receivables before collections begin. Monsoon and winter demand reductions cause underutilisation. Post-season product returns, near-expiry stock write-offs and heavy promotional spending erode margins further. Integrating sales and production planning can help avoid overproduction of ice cream products.
Monthly or quarterly profitability and cash-flow projections – not just annual averages – are essential. These should account for ice cream cold storage and hardening tunnel requirements and align with the project’s ice cream plant revenue model, distribution network and seasonality strategy.
Product-Wise Profitability and Contribution Analysis
Industrial ice cream business profitability is driven not only by total litres sold but by the contribution profile of each product category. Focus on high-margin product lines to increase profitability. Profit margins for premium ice cream can be as high as 65%, while ice cream parlors serving one scoop at $1.00 to $2.00 – with cost of producing one scoop of premium ice cream reaching £1.20 – operate in a different format entirely.
A product-wise analysis table should cover: product category, net realisation per unit, variable cost per unit, contribution per unit, contribution ratio, sales volume and total contribution. A high-margin line with limited volume may contribute less than a mass-market format with moderate margins and strong throughput across all making ice cream categories.
Excessive SKU proliferation (too many ice cream business ideas without market validation or market analysis) increases changeover losses, packaging inventory, production complexity and slow-moving stock risk. Periodic rationalisation of low-contribution SKUs improves overall margins without additional capex.
Common Causes of Low Profitability in Ice Cream Manufacturing
Many plants struggle not because market demand is weak, but because assumptions in their business plan and financial plan are unrealistic. Common causes include over-optimistic sales projections and capacity-utilisation targets; excessive distributor discounts eroding net realisation; incorrect product costing; volatile milk-solid or fat costs (with labor costs and production costs rising faster than price adjustments); packaging wastage; frequent changeovers with effective waste management failures during production transitions; refrigeration inefficiencies; high product returns; weak receivable collection; and high working-capital interest.
Ignoring the real ice cream plant revenue and expenses pattern across the year often leads to surprise cash losses despite positive annual EBITDA. Periodic variance analysis between projected and actual contribution is essential. Net profit for a small ice cream business may reach only $350 monthly when these issues compound – industrial plants face proportionally larger risks. These areas must feature in the risk section of any ice cream manufacturing DPR.
Practical Measures to Improve Ice Cream Plant Profitability
There is no single lever. Operational efficiency improves through a combination of measures: regular product-wise contribution monitoring; tighter procurement from reliable suppliers and dairy farmers; reduction of mix losses and overrun deviations during the production process; energy-efficiency investments; rationalisation of poor-performing SKUs; better sales forecasting; and control over trade discounts. Route and cold chain logistics optimisation, higher drop density and balanced freezer placement reduce returns. Financial discipline – working-capital monitoring, receivable follow-up, inventory ageing reviews – completes the picture. These should feed into updated financial projections demonstrating improved project economics without over-promising results. A feasibility report should reflect long term sustainability, not just launch-year optimism.
Break-Even and Profitability Analysis in a Bankable Ice Cream DPR
Banks expect structured ice cream project financial analysis – not just a cost sheet. Essential elements include: basis of installed and practical capacity, year-wise utilisation ramp-up, product-wise production volumes, net sales realisation, raw-material consumption norms, variable and fixed cost classification, contribution margin, break-even sales and capacity, margin of safety, projected profitability, cash accrual, DSCR and sensitivity analysis.
The project report must cross-reference technical sections on industrial ice cream manufacturing process and production line so that technical capacity matches financial assumptions. CA Manish Gugliya assists promoters in preparing structured DPRs, financial projections and CMA Data, while clarifying that future projections are estimates and do not guarantee loan sanction or project performance.
Common Break-Even Analysis Mistakes to Avoid
Even well-prepared reports contain errors that distort ice cream plant break-even analysis: using MRP instead of net realisation; treating all power and refrigeration as fixed costs; ignoring cold-chain and distribution expenses; equating installed capacity with achievable sales; neglecting returns and expiry; applying a single contribution rate to an unrealistic product mix; excluding seasonal promotional spending; ignoring working-capital interest; confusing profit with cash flow; and presenting preliminary assumptions as verified data.
All assumptions in ice cream plant financial projections should be documented transparently with supporting quotations or technical estimates. Promoters should review their project report with their Chartered Accountant and technical advisors before submission to lenders.
Practical Checklist for Promoters Before Finalising Projections
Before freezing your DPR projections, assemble:
- Product-wise installed and practical capacity
- Expected product mix by litres and value (including seasonal flavors and new flavors)
- Net selling price after trade margins and taxes
- Raw-material and packaging consumption norms for all key ingredients
- Utility consumption per litre (power, fuel, water)
- Labour requirements by shift
- Refrigeration and storage expenses
- Cold-chain freight model
- Expected sales returns percentage
- Key fixed overheads
- Working-capital cycle assumptions
- Term-loan interest, moratorium and repayment schedule
- Seasonal sales pattern and marketing plan
- Capacity ramp-up plan for years 1–5
- Contingency for adverse input-cost or realisation movements
Documenting these inputs supports not only your financial plan but also later performance review against the original assumptions.
Frequently Asked Questions
Is an industrial ice cream manufacturing plant always profitable?
No. Profitability depends on net realisation, realistic capacity utilisation, cost control, product mix and financing structure. Growing market demand for ice cream across age groups and channels (including convenience stores and export markets) creates opportunity, but there is no guaranteed profit simply because the ice cream industry is expanding.
How can I estimate ice cream production cost per litre?
Build it from the bottom up: recipe-wise milk and fat inputs, sugar, stabilisers, flavours, inclusions, packaging, utilities, labour and normal wastage. Use plant-specific technical data and current raw-material quotations from reliable suppliers rather than generic averages. Ice cream production costs include milk, cream, sugar and utilities as the primary components.
How does seasonality change my break-even assessment?
While annual break-even may be achieved at 60–65% utilisation, monthly analysis often reveals cash deficits in off-season months. Working-capital lines, inventory planning and seasonal promotional spending must be designed around seasonal demand fluctuations to maintain liquidity.
Can strong break-even analysis alone secure bank finance?
No. Banks examine project cost, means of finance, promoter contribution, collateral, DSCR, management capability, market analysis and regulatory compliance. A sound break-even analysis is necessary but not sufficient for loan sanction.
What is the difference between accounting break-even and cash break-even?
Accounting break-even occurs when PBT equals zero after charging depreciation and interest. Cash break-even ignores non-cash depreciation and focuses on whether cash inflows cover all cash outflows – a stricter and more practical test of whether the plant can meet its payment obligations and sustain operations.
For a customised industrial ice cream plant DPR, project-cost assessment, financial projections, profitability and break-even analysis, CMA Data preparation or bank-finance documentation support, promoters may consult CA Manish Gugliya, FCA, DISA (ICAI), through www.projectreportbank.com. Projections are professional estimates prepared on stated assumptions and do not constitute guarantees of profitability, loan sanction or investment returns.