Key Takeaways
- Specialty flour products (multigrain atta, fortified wheat flour, high-fibre and organic atta) can be profitable in India, but only when backed by realistic demand validation, disciplined costing and conservative financial projections rather than optimistic spreadsheets.
- A structured specialty flour plant feasibility study must evaluate market feasibility, technical and process feasibility, project cost, working capital, profitability, break-even capacity, ROI, IRR and DSCR before finalising any flour mill project or flour factory investment.
- Product mix, capacity planning and distribution strategy influence margins more than simply installing higher TPD capacity in a manufacturing plant; a 50 TPD unit with strong local demand can outperform a 200 TPD unit that struggles to fill orders.
- Banks and financial institutions primarily examine realistic DPRs, CMA Data, DSCR analysis and promoter contribution when financing a specialty flour mill business; attractive projected PAT alone does not establish bankability.
- Project Report Bank, led by CA Manish Gugliya (FCA, DISA), prepares customised feasibility reports, financial models and bankable DPRs for MSMEs and entrepreneurs evaluating specialty flour plant investment opportunities across India.
Introduction: Why Specialty Flour Plant Feasibility Matters in India
India’s wheat flour market has shifted from a commodity business to a differentiated product category. The packaged atta market reached approximately INR 95.1 billion in 2025 and is projected to grow to around INR 286.4 billion by 2034, at a CAGR of roughly 12.64%, according to IMARC Group estimates. Urbanisation, health awareness, hygiene concerns and organised retail expansion since 2018 have driven consumers toward multigrain atta, fortified wheat flour, high-fibre variants and organic alternatives. Globally, the cereal flour market was valued at USD 142.14 billion in 2025, is expected to reach USD 232.10 billion by 2034, and is growing at a CAGR of 5.6% from 2026 to 2034. Cereal flour serves as essential raw material in bakery and snack production, and specialty flour demand is increasing alongside staple flour in mature markets.
Specialty flour manufacturing can command higher selling prices than ordinary atta, but margins depend on procurement cost, processing losses, quality assurance, packaging formats and distribution economics. A growing product category does not automatically guarantee individual project profitability. Wrong capacity selection, overestimated sales or underestimated operating costs can turn a promising flour mill business plan into a stressed asset within 18 months of commissioning.
This article is a professional guide from a Chartered Accountant’s perspective, aimed at entrepreneurs, MSMEs, existing flour mill business owners and investors who want to evaluate specialty flour manufacturing plant viability before approaching banks for term loans or working capital finance.
What Is a Specialty Flour Plant Feasibility Study?
A specialty flour plant feasibility study is a structured assessment of whether a proposed multigrain or specialty atta manufacturing plant is technically workable, commercially sustainable and financially viable in a specific Indian location. Conducting a feasibility study requires analyzing technical viability and market success across five dimensions: technical feasibility (can you produce the product consistently?), market and demand feasibility (will enough buyers pay a price that covers your costs?), manufacturing and operational feasibility (can the process run at planned throughput?), financial feasibility (do projected cash flows justify the capital outlay?) and regulatory feasibility (does the operation comply with FSSAI, Legal Metrology and environmental norms?).
Investment and project viability analysis goes beyond basic profitability analysis. It examines cash flows, DSCR, internal rate of return, sensitivity to adverse scenarios and working capital adequacy, helping promoters decide Go, Conditional Go or No-Go before committing capital. A feasibility study is not identical to a DPR or a standalone business plan; a bankable DPR usually integrates all these analyses into a single document with CMA Data, financial projections and project cost estimates.
At Project Report Bank, feasibility studies are customised to each plant’s capacity, location, raw material sourcing and product mix rather than relying on generic flour milling templates.
Specialty Flour Products Considered in the Feasibility Analysis
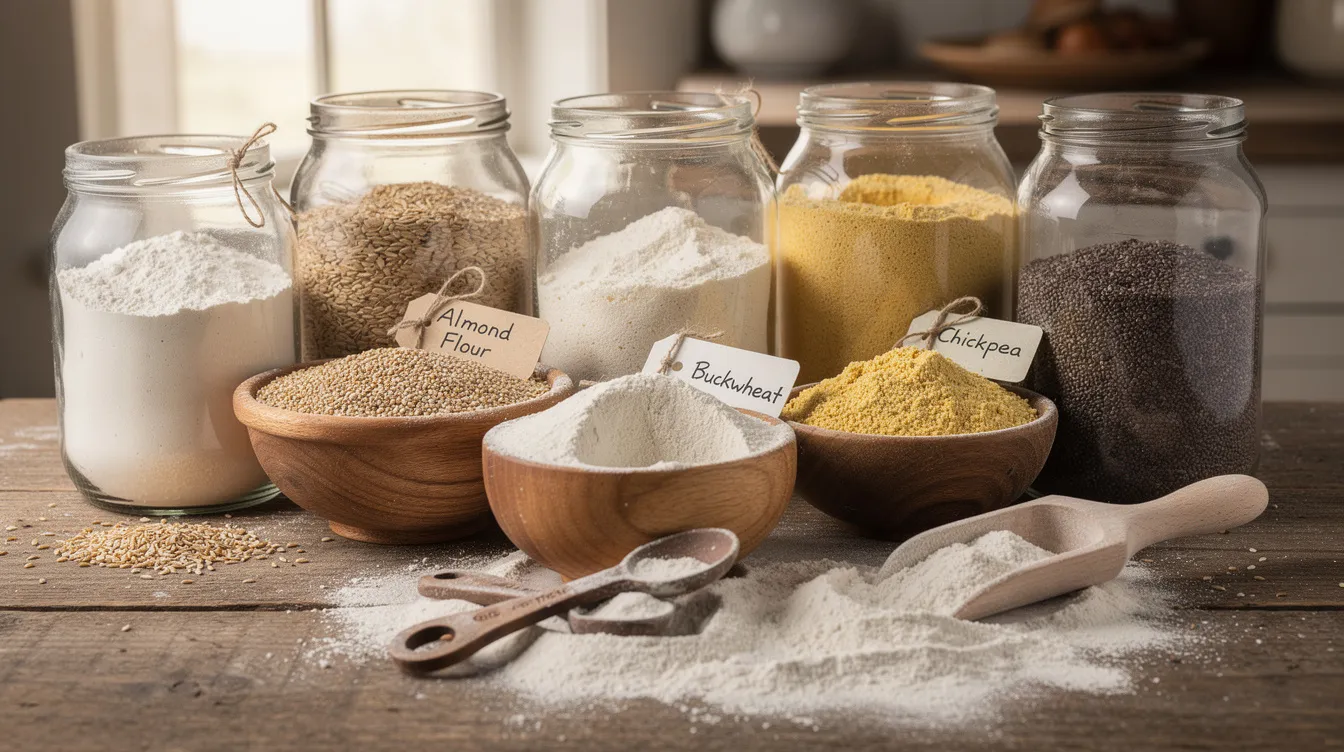
The main specialty flour categories relevant in India include multigrain atta, fortified wheat flour (compliant with FSSAI fortification standards requiring Iron at 20 mg/kg, Folic Acid at 1,300 µg/kg and Vitamin B12 at 10 µg/kg), high-fibre atta, organic atta and customised specialty flour blending such as millet-based mixes or purpose-specific bakery blends. Each category differs in formulation, raw material sourcing (wheat, millets, pulses, seeds), certification requirements and target customer segments. The incremental cost of fortifying wheat flour is relatively small at approximately ₹0.07 to ₹0.08 per kg.
| Product Category | Manufacturing Complexity | Raw Material Considerations | Target Market | Quality Requirements | Principal Commercial Risks |
|---|---|---|---|---|---|
| Multigrain Atta | Medium-High; blending uniformity critical | Wheat, millets, pulses, seeds; diverse sourcing | Health-conscious retail, modern trade | Blend consistency, nutritional claims | Higher input costs, consumer scepticism on grain percentages |
| Fortified Wheat Flour | Medium; micro-dosing of premixes | Wheat plus iron/folic acid/B12 premix | Retail, institutional, PDS | FSSAI fortification compliance, +F logo | Regulatory non-compliance risk, small price premium |
| High-Fibre Atta | Medium; extraction rate control | Wheat bran, fibre-rich grains | Urban health segment, diabetics | Fibre content, texture consistency | Narrow consumer base, shelf-life management |
| Organic Atta | Medium; separate storage and handling | Certified organic wheat, higher procurement cost | Premium retail, e-commerce | NPOP/PGS organic certification, no contamination | Supply inconsistency, certification cost, lower yield |
| Specialty Flour Blending | Variable; depends on formulation count | Maize, ragi, jowar, pulses, wheat | Bakeries, QSR chains, B2B food manufacturers | Cross-allergen prevention, batch coding | Complex QC, limited retail awareness |
A serious feasibility study should not assume all specialty flours can be produced using identical milling and blending processes. It should evaluate which SKUs to introduce initially and how they impact plant layout and economics.
Market Feasibility and Demand Assessment
The most efficient manufacturing plant fails if market demand is overestimated. Market feasibility is the first filter before finalising capacity or machinery orders. Market demand assessment includes current and projected demand for specialty flours in the target geography, pricing benchmarks against national and regional brands, retailer and distributor margin expectations, and institutional buyer requirements. Urbanization drives 5-8% annual growth in commercial flour demand in emerging markets, and wheat flour plants in these markets see similar growth. Promoters should identify target customers such as food manufacturers and artisanal bakeries alongside retail consumers.
Market research is essential for establishing realistic sales volumes and prices. Product quality often competes on performance and consistency, not just price, especially in specialty flour where nutrition claims and brand trust carry weight. Competition from established brands like Aashirvaad, Fortune and Patanjali, as well as strong regional flour mills, must be factored into realistic market share assumptions.
| Demand Validation Step | Purpose |
|---|---|
| Sample surveys in 2-3 target districts | Gauge consumer willingness to pay for specialty atta |
| Pilot distribution in 1-2 cities | Test actual sell-through before scaling |
| Retailer feedback on pack sizes and pricing | Align product format with shelf economics |
| Confirmed B2B enquiries or letters of intent | Establish baseline institutional demand |
| Pre-launch orders from distributors | Reduce initial inventory risk |
Plant capacity must be linked to achievable sales ramp-up and realistic distribution coverage, not only to theoretical flour milling capacity.
Technical Feasibility of Specialty Flour Manufacturing
Technical feasibility covers selection of the process route, configuration of milling and blending equipment, quality control systems and utilities planning. Consistent wheat quality is the baseline requirement; sourcing millets, pulses, fortification premixes and organic-certified grains adds procurement complexity. Evaluate the availability and cost stability of raw grains for specialty flour production before committing to a product mix. Reliable contracts with farmers prevent supply disruptions in raw material sourcing, especially for organic and millet-based variants where seasonal availability fluctuates.
The manufacturing process for specialty flour includes cleaning, de-stoning, grading, conditioning, milling, sifting, blending, fortification dosing (where applicable), packaging and storage. Wheat cleaning systems are sized at 110%-120% of rated capacity to handle throughput variations. Specialized milling machinery is required for processing gluten-free and specialty grains. Specialty flour plants may require equipment that prevents cross-contamination between product lines. Promoters must conduct site assessments to ensure access to adequate infrastructure and utilities, and assess access to raw materials and customers when selecting a plant location.
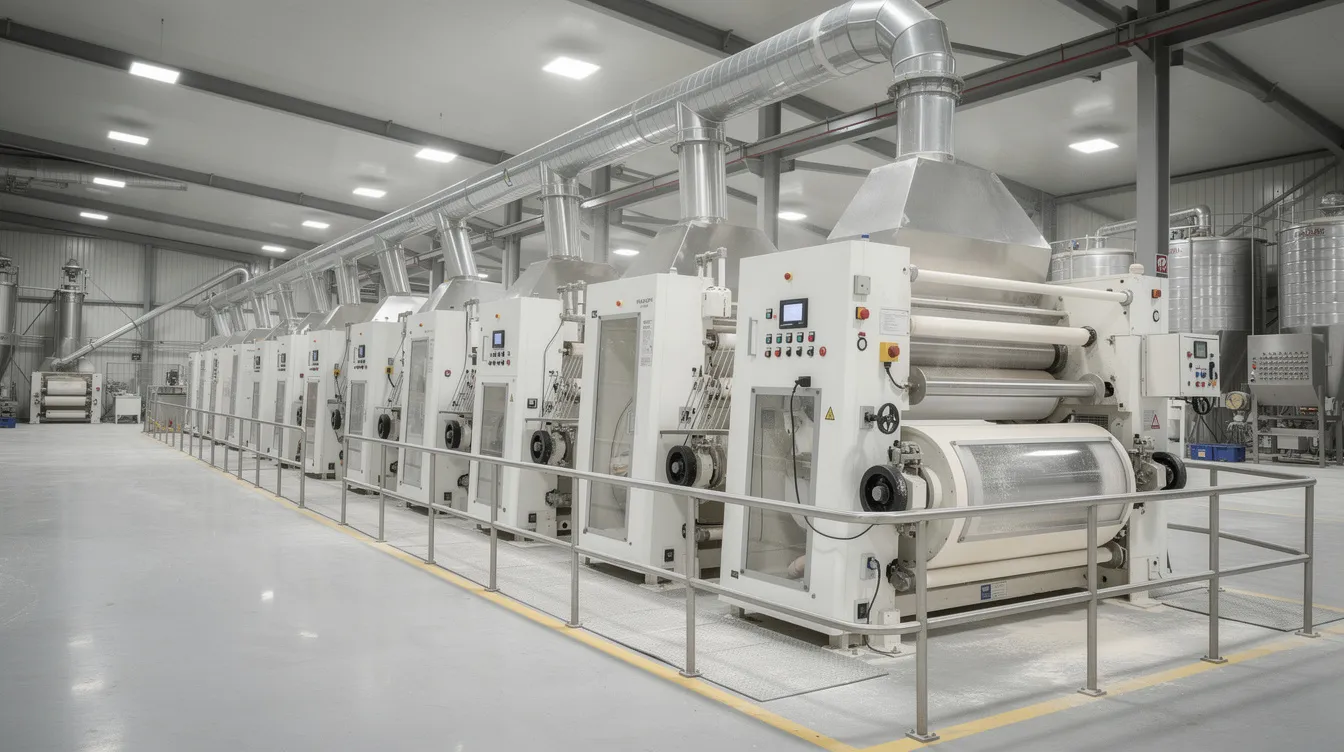
Selection of plant and machinery requires evaluating roller mills, plansifters, ribbon blenders, micro-dosing systems, auto-packing machines, metal detectors and lab QC instruments. Establish product specifications for moisture, particle size, and functional properties before finalising equipment. Practical technical issues such as processing losses (higher for high-fibre variants), dust control, PLC/SCADA-based automation and traceability, and power and water requirements differ across TPD capacities.
Capacity Planning, Product Mix and Plant Configuration
Capacity planning is central to any flour mill project. Installed capacity in TPD affects project cost, fixed overheads, achievable economies of scale and project viability. A 300 TPD plant requires 3,500 to 4,200 m² of area, while a 500 TPD facility can produce over 150,000 tons annually. Annual production capacity for cereal flour plants ranges from 100,000 to 500,000 MT depending on configuration. Vertical layouts are standard for 200 to 500 TPD projects to optimise gravity-fed material flow.
Promoters should estimate operating days (typically 300 to 330 per year), shift patterns and realistic capacity utilisation ramp-up over 3 to 5 years rather than assuming 90-100% from day one. A 50% utilisation in Year 1 ramping to 80% by Year 4 is more defensible than projecting 85% from commissioning. The capacity planning and product mix guide on Project Report Bank covers detailed analysis for different scales.
Consider a 30 TPD semi-automatic unit targeting a single state versus a 100 TPD automated plant supplying multiple states and institutional buyers. The smaller unit requires less capital and working capital, achieves break-even faster with lower sales volume, but sacrifices per-unit cost advantages. The larger plant benefits from economies of scale but needs a wider distribution network and higher working capital to fill capacity. The difference between installed capacity, technically achievable production and actual sales volume determines whether assets are utilised or idle.
Specialty Flour Plant Investment Cost and Means of Finance
Project cost for a specialty flour plant includes land, civil works, machinery, utilities, pre-operative expenses and initial working capital margin. Costs differ by location and automation level. Flour mill setup costs range from USD 0.5 to 10 million depending on scale. A 100 TPD wheat flour plant costs approximately USD 2 to 3 million to build, while a 500 TPD flour plant requires an investment of USD 9 to 12 million. Machinery costs account for 45% to 55% of total setup costs.
| Component | Illustrative % of Fixed Capital |
|---|---|
| Land and site development | 10-15% |
| Factory building and civil works | 20-28% |
| Plant and machinery (including installation) | 45-55% |
| Electrical equipment and utilities | 5-8% |
| Lab, QC, packing equipment | 3-5% |
| Pre-operative expenses and contingencies | 5-8% |
Total funding requirement includes both project cost and long-term working capital needs, especially during the first 6 to 12 months when the flour factory is ramping up sales and may incur initial operating losses. For more granular benchmarks, the specialty flour plant setup cost and project cost and means of finance guides provide scale-specific data.
An illustrative means of finance for a medium-scale plant might allocate 30-35% as promoter equity, 55-60% as term loan and 5-10% as unsecured promoter loans, yielding a debt-equity ratio of roughly 1.5:1 to 2:1. Financing plans must assess working capital needs during the production ramp-up phase separately from fixed capital.
Operating Cost Structure and Manufacturing Economics
Operating costs for a specialty flour mill business include variable costs (wheat and other grains, pulses, millets, fortification premix, packaging, power, labour) and fixed costs (salaries, rent, maintenance, insurance, administration). Raw materials account for 85-90% of operating expenses in flour production. Operating costs account for 85-90% of total expenses overall. Labour represents 12% to 15% of total expenses. Calculate operating costs including raw materials, utilities, and labor to arrive at cost per kg of finished product.
| Cost Head | Approximate Share of Total Cost |
|---|---|
| Raw materials (wheat, grains, premixes) | 60-70% |
| Packaging materials | 6-10% |
| Power and fuel | 4-6% |
| Wages and salaries | 6-8% |
| Selling and distribution | 3-5% |
| Repairs and maintenance | 1-2% |
| Interest and finance charges | 2-4% |
| Admin and indirect costs | 2-3% |
Gross profit margins for cereal flour plants range between 10-15%. Premium MRP does not automatically result in superior margins if input costs, trade discounts and promotional expenses are also high. Procurement strategy (buying wheat during harvest season versus staggered procurement) and the current MSP for wheat at ₹2,585 per quintal directly affect contribution margin.
Financial Feasibility, Profitability Projections and Break-Even Analysis
The financial feasibility model should prepare cash flows and projected balance sheets alongside the projected profit and loss statement. Financial modeling includes calculating total capital expenditure and operational costs, while a detailed financial model should project revenues, expenses, and return on investment over 5 to 7 years with consistent assumptions.
| Year | Capacity Utilisation | Sales (₹ Cr) | EBITDA (₹ Cr) | PAT (₹ Cr) |
|---|---|---|---|---|
| 1 | 50% | 8.50 | 0.68 | 0.15 |
| 2 | 60% | 10.20 | 0.92 | 0.32 |
| 3 | 70% | 11.90 | 1.19 | 0.52 |
| 4 | 80% | 13.60 | 1.46 | 0.72 |
| 5 | 80% | 14.30 | 1.58 | 0.85 |
Illustrative only; based on a hypothetical 50 TPD specialty flour plant with blended product mix. These are assumptions-based estimates, not guaranteed financial results.
Break-even sales can be estimated using the formula: Break-Even Sales = Fixed Costs ÷ Contribution Margin Ratio. If annual fixed costs are ₹1.10 crore and contribution margin ratio is 18%, break-even sales equal approximately ₹6.11 crore, corresponding to roughly 45% capacity utilisation. A 300 TPD plant can generate USD 1.8 to 2.9 million gross profit annually at reasonable utilisation levels. The financial projections, working capital and DSCR guide provides detailed templates for building these models.
ROI, IRR, NPV, DSCR and Loan Repayment Capacity
Return Metrics
Return on Investment measures annual net profit relative to total project cost. Project IRR captures the discount rate at which cumulative project cash flows equal zero; equity IRR isolates returns to the promoter’s own capital. Higher leverage can raise equity IRR while also increasing financial risk; a project with 16% project IRR might show 22% equity IRR with 60% debt, but the same leverage amplifies losses if revenue falls short. Investment recovery periods typically range from 3 to 5 years for well-planned flour mill projects.
DSCR and Debt Service
DSCR = Cash Available for Debt Service ÷ Total Debt Service, where cash available equals net profit plus depreciation plus interest, and total debt service equals principal repayment plus interest. Banks typically expect average DSCR of 1.25 or above under conservative assumptions.
| Year | Net Profit + Dep. + Interest (₹ Lakh) | Total Debt Service (₹ Lakh) | DSCR |
|---|---|---|---|
| 1 | 82 | 65 | 1.26 |
| 2 | 105 | 68 | 1.54 |
| 3 | 128 | 68 | 1.88 |
Illustrative; actual DSCR depends on loan tenure, moratorium and interest rate. Profitability on paper does not necessarily mean adequate cash flow for loan repayment.
Proper DSCR analysis embedded in CMA Data strengthens a bank’s confidence in the flour mill business plan. Project Report Bank’s financial projections and modelling services can help promoters build internally consistent models.
Working Capital Feasibility, Sensitivity Analysis and Risk Assessment
Working Capital Drivers
| Working Capital Component | Holding Period (Days) | Illustrative Amount (₹ Lakh) |
|---|---|---|
| Raw material inventory | 30 | 45 |
| Packing material stock | 15 | 8 |
| Finished goods | 10 | 22 |
| Receivables from distributors | 30 | 38 |
| Less: Creditors | 15 | (18) |
| Net Working Capital Requirement | 95 |
Longer receivable days from modern trade and newer SKU lines can push working capital requirements 20-30% above initial estimates. Financing plans must assess working capital needs during the production ramp-up explicitly.
Sensitivity Analysis
Evaluate the impact of raw material price volatility on project viability. Conduct risk assessments to identify vulnerabilities and outline mitigation strategies.
| Stress Scenario | Impact on EBITDA | Impact on DSCR | Impact on IRR |
|---|---|---|---|
| Grain prices +10% | -15% to -20% | -0.15 to -0.25 | -2% to -3% |
| Selling price -5% | -12% to -18% | -0.10 to -0.20 | -1.5% to -2.5% |
| Utilisation at 50% vs 80% | -35% to -45% | May fall below 1.0 | -5% to -8% |
| Interest rate +200 bps | -5% to -8% | -0.08 to -0.12 | -1% to -1.5% |
Risk Matrix
| Risk Category | Financial Impact | Mitigation Strategy |
|---|---|---|
| Raw material supply disruption | Production stoppage, cost escalation | Multi-sourcing, harvest-season procurement contracts |
| Quality / contamination failure | Recalls, regulatory penalties | Robust QA, metal detection, batch traceability |
| Market acceptance below plan | Under-utilised capacity, cash flow stress | Phased capacity, B2B contracts before retail launch |
| Regulatory non-compliance | Product seizure, licence suspension | FSSAI compliance audit before commissioning |
| Financing cost increase | Higher debt service, lower equity return | Conservative leverage, fixed-rate options where possible |
Regulatory and Compliance Feasibility for Specialty Flour Plants
Regulatory compliance is non-negotiable. Certifications like FSSAI and HACCP may be necessary for food safety compliance. Identify mandatory food safety regulations and compliance requirements before finalising plant design. Food safety standards are stringent for specialized and health-oriented foods. FSSAI’s fortification regulations mandate specific micronutrient levels in fortified wheat flour and require the +F logo on compliant products. Organic atta requires NPOP or PGS-India certification with separate storage to prevent contamination.
Packaging and labelling must comply with Legal Metrology rules covering net quantity, MRP, batch coding and nutritional information. GST registration with correct HSN classification, factory registration, labour law compliance (ESIC, EPF), fire safety and pollution-control consents apply depending on plant size and location. Promoters should verify current requirements through official government portals before finalising the feasibility report.
How Banks and Investors Evaluate a Specialty Flour Plant DPR
Banks and financial institutions review a specialty flour plant project report for credible market analysis, logical capacity selection, realistic pricing and conservative cost estimates. Common appraisal areas include promoter background, track record in food or flour milling, availability of equity, project cost supported by machinery quotations, environmental clearances and collateral coverage.
Lenders examine financial projections for assumptions on capacity utilisation, sales growth, working capital cycle, margin stability, interest coverage and DSCR under adverse scenarios. Project Report Bank’s bank finance DPR and loan proposal assistance supports professional loan proposal preparation, though sanction depends on lender assessment. Early engagement with a professional DPR consultant helps align project structure with lender expectations.
Go / Conditional Go / No-Go: Deciding on Specialty Flour Plant Viability
| Parameter | Go | Conditional Go | No-Go |
|---|---|---|---|
| Market validation | Confirmed orders or pilot sales | Positive feedback, no firm orders | No evidence of demand |
| Contribution margin | Above 15% consistently | 10-15% with improvement path | Below 10% |
| DSCR (conservative case) | Above 1.25 | 1.0-1.25 | Below 1.0 |
| Equity IRR | Above 18% | 12-18% | Below 12% |
| Working capital adequacy | Fully funded for 12 months | Partially funded, plan for gap | Unfunded |
| Regulatory readiness | All licences in place | Applications filed, timeline clear | No clarity |
| Raw material security | Contracts or consistent supply | Seasonal with mitigation plan | Single-source, volatile |
Conditional Go situations often call for revising capacity downward, adjusting product mix toward validated SKUs or adding B2B contracts before proceeding. This systematic approach reflects the practical methodology used by CA Manish Gugliya when advising MSMEs on project viability.
Professional Feasibility Study, DPR and Advisory Support from Project Report Bank
At Project Report Bank, I work with promoters to evaluate whether a proposed specialty flour plant makes commercial and financial sense before they commit capital. Core services for specialty flour projects include customised project feasibility studies, bankable DPR preparation, detailed financial projections and financial modelling, CMA Data preparation, project cost and means-of-finance planning, break-even and DSCR analysis, and sensitivity and risk assessment.
Professional feasibility study assignments for specialty flour plants generally start from ₹50,000, with actual fees depending on project size, complexity, data availability and depth of analysis. Promoters can share basic project details (proposed capacity, location, product mix, estimated project cost) via WhatsApp or the website contact form at www.projectreportbank.com to receive a customised scope and fee proposal. No fixed ROI, IRR or loan approval can be guaranteed.
Frequently Asked Questions
Below are concise answers to common questions about specialty flour plant feasibility that supplement the detailed analysis above.
Is specialty flour manufacturing always more profitable than regular wheat flour milling?
Specialty flour can command higher selling prices per kg, but profitability depends on contribution margin after accounting for higher raw material costs (millets, organic grain, premixes), packaging, marketing and channel margins. In some markets, a well-run regular wheat flour mill with strong volumes and tight cost control may outperform a poorly planned specialty flour plant. A feasibility study helps compare realistic economics rather than relying on assumptions about premium pricing.
How much time does a professional specialty flour plant feasibility study usually take?
For a typical MSME-scale project in India, a customised feasibility study with financial modelling generally requires 3 to 5 working weeks from the date complete data is received. Additional time may be needed if the scope includes multiple location comparisons, detailed market surveys or iterative discussions with bankers and potential investors.
Can an existing wheat flour mill be upgraded into a specialty flour manufacturing plant?
Many existing flour mills can be upgraded by adding blending, fortification and specialised packing lines, provided their basic milling, cleaning and storage infrastructure meets required quality and hygiene standards. A focused technical-cum-financial feasibility assessment evaluates incremental machinery cost, plant layout changes, downtime impact and revised product mix economics before implementing such an upgrade.
What information should promoters provide for a detailed feasibility report and DPR?
Key inputs typically required include proposed location, land status, tentative capacity in TPD, product range, target markets, existing business background, estimated project cost, proposed funding structure and any early discussions with machinery suppliers or buyers. The better the initial clarity and data, the more realistic and decision-oriented the feasibility report and flour mill business plan will be.
How often should the feasibility assumptions be revisited for a specialty flour project?
Feasibility assumptions should be revisited whenever there is a notable change in grain prices, interest rates, tax structure, regulatory norms or competitive intensity, and at least once before finalising machinery orders and again before financial closure. Periodic review helps promoters adapt plant capacity, investment phasing and working capital planning to current market realities, reducing the risk of avoidable surprises after project implementation.
CA Manish Gugliya FCA, DISA (ICAI) More than 20 years of professional experience in project reports, financial projections, CMA Data, project finance and business advisory. Website: www.projectreportbank.com