Key Takeaways
- Specialty flour plant financial projections must be operations-driven – linked to installed capacity, extraction yields, product mix and realistic ramp-up assumptions – rather than built from arbitrary revenue targets.
- All three projected statements (Profit and Loss, Balance Sheet, Cash Flow) should be prepared from one integrated set of assumptions so that revenue, costs, borrowings, repayments and ratios reconcile across the model.
- Working capital assessment and DSCR, not just projected profit, largely determine whether banks sanction a term loan and cash credit facility for a flour mill project.
- A well-prepared Detailed Project Report with consistent CMA Data improves the quality of credit appraisal discussions and reduces back-and-forth with lenders.
- CA Manish Gugliya and Project Report Bank prepare customised DPR, CMA Data and financial models for specialty flour manufacturing plants across India, tailored to each project’s actual capacity, cost structure and funding requirements.
This article walks through the practical financial planning process for a specialty flour plant – from revenue modelling and cost estimation to working capital calculation, DSCR analysis and sensitivity testing.
Introduction – Why Financial Projections Matter for a Specialty Flour Plant
The flour milling industry globally is substantial. The global cereal flour market was valued at USD 142.14 billion in 2025 and is expected to reach USD 232.10 billion by 2034, growing at a CAGR of 4.60% from 2024 to 2032. Asia-Pacific leads in flour production and consumption, driven by urbanization and rising demand for processed staple foods. Within India, increasing urbanization and health awareness are accelerating demand for multigrain atta, fortified wheat flour, organic atta, high-fibre atta and customised blends across urban retail and institutional segments.
A specialty flour plant operates very differently from an ordinary atta chakki or commodity roller flour mill. Product mix, fortification protocols, packaging formats and branding create a cost and pricing structure that requires careful financial analysis before committing capital.
Banks evaluating a flour mill business plan for a bank loan do not stop at projected net profit. They examine cash flow, the working capital cycle, debt service coverage and the consistency of assumptions underlying the financial projections. A project showing attractive margins but insufficient cash accrual to service debt instalments will face difficulties during credit appraisal.
In my professional experience preparing DPRs for flour mill projects, I have seen promoters approach banks with rough estimates of sales and margins, only to discover that their working capital requirement was significantly underestimated or their repayment schedule was too aggressive for the projected ramp-up. Realistic specialty flour plant financial projections, prepared before approaching a lender, help avoid these situations.
Understanding the Financial Structure of a Specialty Flour Manufacturing Plant
The total project cost for a specialty flour plant includes fixed capital investment, pre-operative expenditure and margin money for working capital. Capital expenditures include costs for machinery, facility setup and initial working capital. Cereal flour manufacturing plant setup costs therefore cover both CapEx and OpEx components that must be estimated separately.
A mid-sized flour mill typically requires a startup investment of USD 1.2–1.8 million, while a 500 kg/day mini flour mill may require only ₹9–27 lakh. The following table illustrates cost heads for a medium-scale (30 TPD) specialty flour plant in India:
| Cost Heading | Illustrative Amount (₹ Lakh) |
|---|---|
| Land & Site Development | 30–50 |
| Factory Building & Civil Works | 40–80 |
| Plant & Machinery (milling, blending, packaging) | 80–150 |
| Electrical Installations & Utilities | 10–20 |
| Quality Lab & Testing Equipment | 5–10 |
| Preliminary & Pre-operative Expenses | 8–15 |
| Contingency (5–8%) | 10–20 |
| Margin Money for Working Capital | 15–25 |
| Total Project Cost | ~198–370 |
Machinery cost often accounts for 35–55% of total project cost. Margin money for working capital is included in project cost because promoters must fund the initial operating cycle before bank cash credit limits become operational.
For a detailed breakdown of project cost components and funding sources, refer to the article on Specialty Flour Plant Project Cost & Means of Finance.
Specialty Flour Plant Capacity Planning and Revenue Projections
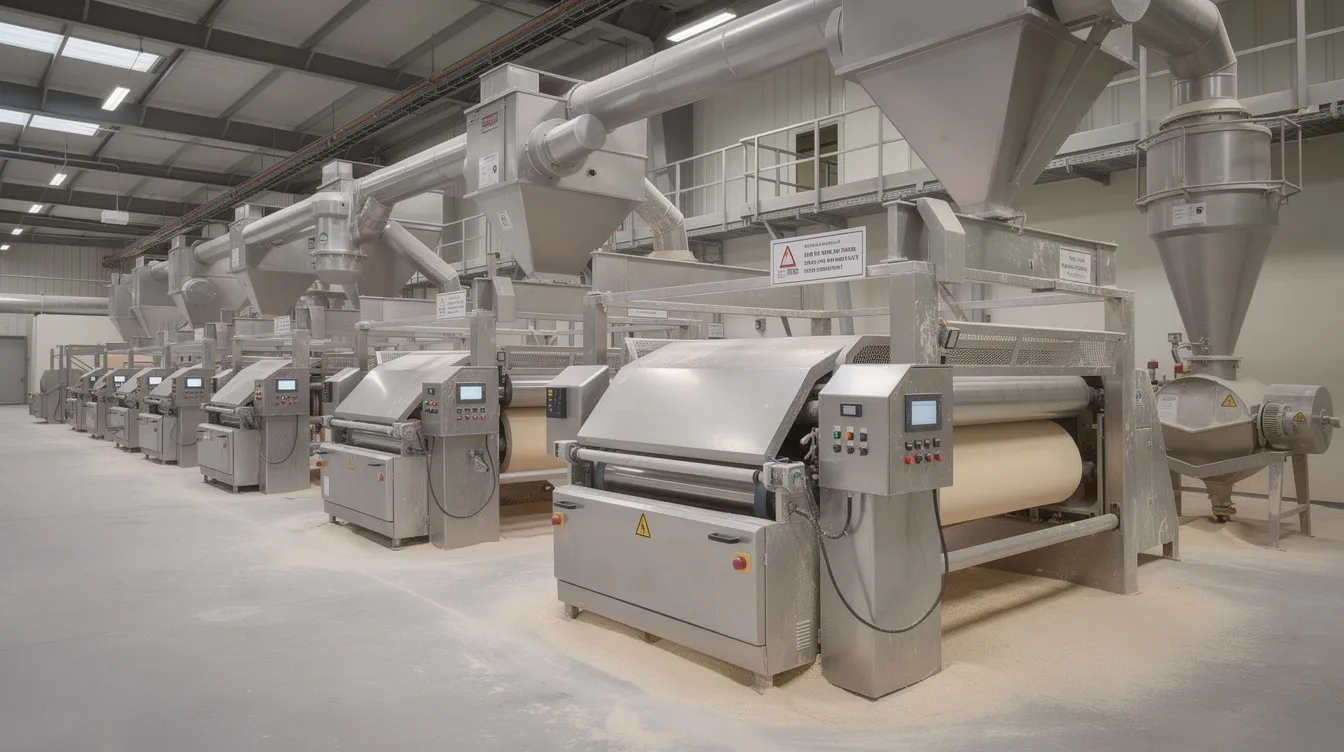
Revenue projections begin with installed production capacity in TPD, operating days (typically ~300 days per year) and capacity utilisation assumptions. For context, large cereal flour manufacturing plants globally can produce 100,000 to 500,000 MT annually, while flour mills in Pakistan alone process over 25 million tons of wheat annually. A specialty flour plant in India operates at a much smaller scale but follows the same planning logic.
Capacity utilisation should reflect realistic ramp-up: perhaps 45–50% in Year 1, 60% in Year 2, 70% in Year 3, reaching 75–80% by Year 4. Financial models for specialty flour businesses should cover multiple revenue streams – each product category carries a different selling price, raw material cost and contribution margin.
| Product | Share of Mix | Quantity (MT/Year at 65% Utilisation) | Avg. Selling Price (₹/kg) | Annual Revenue (₹ Lakh) |
|---|---|---|---|---|
| Multigrain Atta | 45% | 2,633 | 48 | 126.4 |
| Fortified Wheat Flour | 25% | 1,463 | 40 | 58.5 |
| High-Fibre Atta | 15% | 878 | 52 | 45.6 |
| Organic Atta | 10% | 585 | 62 | 36.3 |
| Custom Blends (Institutional) | 5% | 293 | 38 | 11.1 |
| Total | 100% | 5,852 | 277.9 |
Illustrative for a 30 TPD plant at 65% utilisation. Actual prices depend on location, quality and market channel.
Production losses, milling extraction rates and moisture variation mean that wheat input does not equal saleable flour output. By-products such as bran and wheat germ – often sold as animal feed or to food manufacturers – generate additional revenue that financial models must capture. Promoters should validate selling prices through local market surveys before finalising projections. For detailed guidance, see Specialty Flour Plant Capacity Planning & Product Mix.
Raw Material Cost and Manufacturing Expense Projections
Raw material costs – wheat and other grains – typically represent 70–80% of manufacturing cost in a flour mill. Operating costs account for 85–90% of total expenses in flour mills, making raw material sourcing and procurement strategy critical to margins. Annual maintenance costs for flour mills are generally around 2% of machinery value.
| Expense Head | Annual Amount (₹ Lakh) | Cost per kg (₹) |
|---|---|---|
| Wheat & Other Cereals | 160.0 | 27.3 |
| Millets, Pulses & Specialty Ingredients | 18.0 | 3.1 |
| Fortification Premixes | 4.5 | 0.8 |
| Packaging Material | 12.0 | 2.1 |
| Direct Labour | 10.0 | 1.7 |
| Power & Fuel | 9.0 | 1.5 |
| Repairs & Maintenance | 3.5 | 0.6 |
| Quality Control & Lab Testing | 2.0 | 0.3 |
| Factory Overheads | 5.0 | 0.9 |
| Total Manufacturing Cost | 224.0 | 38.3 |
Illustrative for ~5,852 MT annual production. Actual figures vary by location, product mix and procurement contracts.
Fixed operating expenses typically include salaries, rent and insurance. Variable costs in specialty flour production include grain procurement and packaging materials. Semi-variable costs – such as maintenance, overtime wages and administrative overheads – fall in between.
By-product revenue from bran, rejected material or wheat germ (often sold for animal feed or to other food processing units) should be credited against raw material cost in the financial projections. For wheat and maize flour projects, the by-products can offset 1–3% of raw material costs depending on scale and market reach.
Promoters should stress-test projections with 5–10% higher raw material prices and power tariffs. For details on machinery cost and power-intensive equipment, see Specialty Flour Plant Machinery, Equipment & Cost.
Preparing 5–7 Year Financial Projections for a Specialty Flour Plant
Most bankable DPRs and CMA Data for flour mill business finance in India use at least 5 years of projections, sometimes 7 years when the term loan tenure is longer. All three projected statements – Profit and Loss, Balance Sheet, Cash Flow – must be linked to the same operational assumptions. Year 1 projections should ideally be detailed monthly to capture ramp-up and working capital fluctuations.
| Parameter | Year 1 | Year 2 | Year 3 | Year 4 | Year 5 |
|---|---|---|---|---|---|
| Net Sales (₹ Lakh) | 210 | 278 | 320 | 345 | 360 |
| EBITDA (₹ Lakh) | 22 | 38 | 50 | 58 | 64 |
| Depreciation (₹ Lakh) | 14 | 13 | 12 | 11 | 10 |
| Interest – Term Loan (₹ Lakh) | 12 | 10 | 8.5 | 7 | 5.5 |
| PAT (₹ Lakh) | -2 | 10 | 20 | 28 | 34 |
| Closing Net Worth (₹ Lakh) | 78 | 88 | 108 | 136 | 170 |
| Closing Term Loan (₹ Lakh) | 105 | 87 | 69 | 51 | 33 |
Illustrative for a 30 TPD specialty flour plant. Depreciation and taxation assumptions affect profitability measurements in financial models. Actual figures depend on project-specific costs, prices and financing terms.
Projected Profit and Loss Statement
The P&L should flow from gross sales through raw material consumption, manufacturing expenses, employee cost, administrative and selling expenses to arrive at EBITDA. Depreciation and interest on term loan and working capital borrowings are deducted before arriving at profit before tax and then profit after tax.
Raw material consumption should be linked to wheat and grain inputs and extraction yields – not entered as an arbitrary percentage of sales. This ensures the flour mill business plan reflects actual milling economics. Promotional costs, retailer margins and branding spend are especially significant for value-added specialty flours compared to commodity white flour or standard atta.
Projected Balance Sheet
Fixed assets are projected at cost minus accumulated depreciation. Current assets include inventory of wheat and finished specialty flours, trade receivables, cash and bank balances. Current liabilities include trade creditors for wheat and packaging, outstanding expenses and current maturities of long-term debt. Net worth comprises initial share capital plus retained earnings – yearly profit after tax flows into reserves and surplus. All borrowing balances must reconcile with the loan repayment schedule.
Projected Cash Flow Statement
Cash flow is presented under three headings: operating activities (starting from PAT plus non-cash adjustments), investing activities (CapEx) and financing activities (loan drawdowns, repayments, interest, promoter contributions). A year showing accounting profit can still produce negative cash flow if inventory builds up or receivables stretch. Banks pay close attention to whether operating cash flows cover term loan instalments after adjusting for working capital changes.
Important Financial Assumptions
Every flour mill DPR should summarise key assumptions transparently:
| Assumption | Illustrative Value |
|---|---|
| Installed Capacity | 30 TPD |
| Operating Days | 300 per year |
| Year 1 Capacity Utilisation | 50% |
| Selling Price Escalation | 4% per annum |
| Wheat Cost Escalation | 3% per annum |
| Term Loan Interest Rate | 10.5% p.a. |
| Repayment Tenure | 7 years (including 1-year moratorium) |
| Depreciation | As per Companies Act / IT Act |
| Tax Rate | As applicable |
Assumptions must be internally consistent – there should be no mismatch between the DPR text and the linked financial model or CMA Data submitted to the bank.
Working Capital Requirement for Specialty Flour Manufacturing
Working capital assessment is critical for financing raw materials and production. Even a profitable flour mill can face stress if funds for wheat procurement, inventory and receivables are underestimated. This is particularly relevant during seasons of high wheat prices or when institutional buyers delay payments.
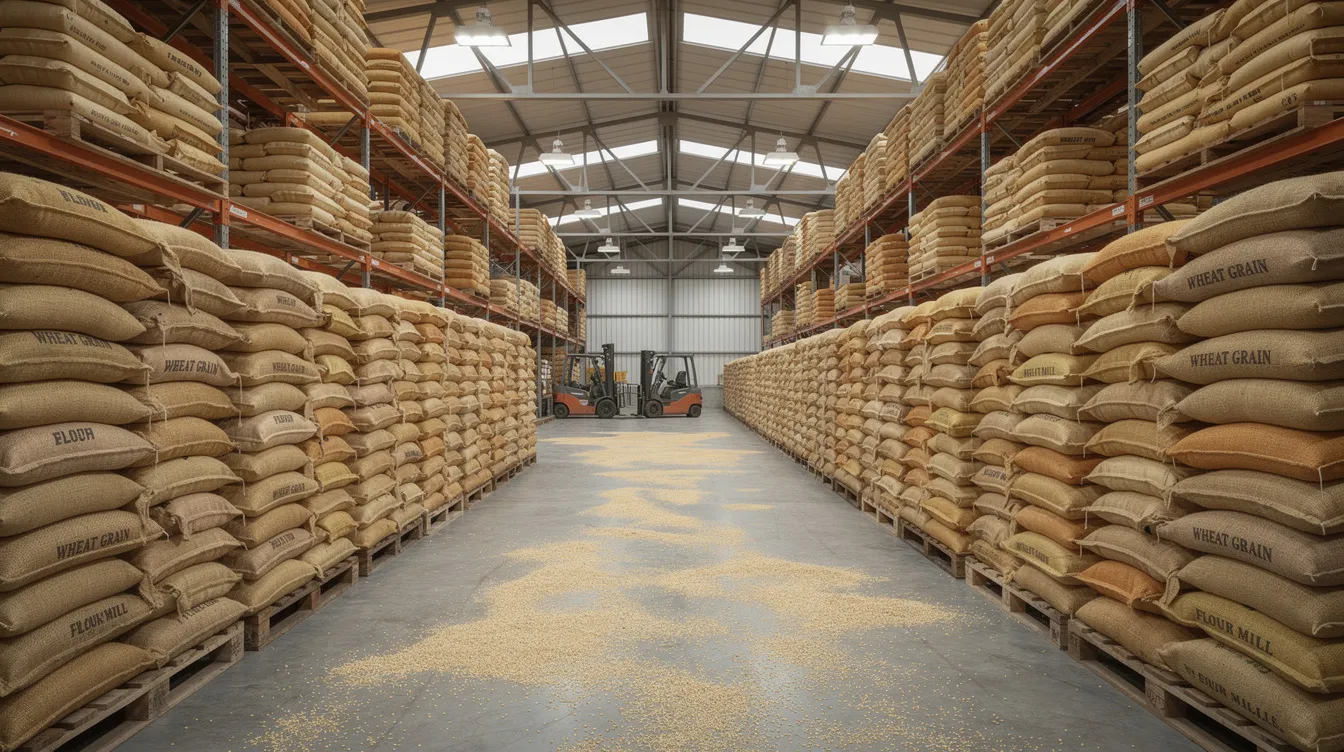
Operating current assets include raw material stock (wheat, millets, pulses), packaging material, finished goods inventory, trade receivables and minimum cash balance. Operating current liabilities include sundry creditors, wages payable, power charges payable and statutory dues.
The operating cycle for a flour mill can be expressed as: days of raw material inventory + finished goods holding days + receivable days − creditor days. Seasonal wheat procurement in India (typically April–June around harvest) can temporarily spike working capital needs even when average annual requirements look comfortable.
Working Capital Calculation Formula
Working Capital Gap = Eligible Operating Current Assets − Eligible Operating Current Liabilities.
Bank finance typically covers 70–80% of this gap, with the balance funded through promoter margin money. The exact percentage depends on the lending institution’s norms and applicable credit policy.
Practical Working Capital Calculation
| Item | Basis (Days) | Amount (₹ Lakh) |
|---|---|---|
| Raw Material Stock | 30 days of consumption | 13.3 |
| Packaging Material | 15 days | 1.5 |
| Finished Goods | 7 days of cost of production | 4.3 |
| Trade Receivables | 30 days of sales | 23.2 |
| Cash & Bank Balance | Minimum | 2.0 |
| Total Current Assets | 44.3 | |
| Less: Trade Creditors | 20 days of purchases | 8.9 |
| Less: Other Current Liabilities | 3.0 | |
| Total Current Liabilities | 11.9 | |
| Net Working Capital Gap | 32.4 | |
| Bank CC Limit (75% of gap) | 24.3 | |
| Promoter Margin (25%) | 8.1 |
Illustrative. Actual assessment depends on bank norms, stock verification and drawing power calculations.
Cash Credit Limit and Working Capital Finance
A cash credit facility for a flour mill is secured against stock and receivables. Banks maintain drawing power limits based on monthly stock and receivable statements, and interest is charged on daily utilisation. Inadequate CC limits force mills to buy wheat in smaller lots at adverse prices or run at lower capacity utilisation – directly reducing profitability and DSCR. Promoters should prepare a month-wise cash flow for Year 1 to verify whether sanctioned limits cover procurement, processing and payment cycles.
CMA Data Preparation for Specialty Flour Plant Bank Loans
CMA Data (Credit Monitoring Arrangement) is a structured set of past and projected financial statements used by Indian banks for working capital and term loan appraisal. For a new specialty flour project, only projected figures are available, so CMA must align precisely with the DPR’s project cost, means of finance, capacity assumptions and repayment schedule.
Major CMA components include projected profit and loss, balance sheet, fund flow, working capital assessment (MPBF) and key financial ratios. Regulatory compliance and quality assurance costs – including FSSAI licensing, fortification testing and organic certification where applicable – must be factored into the projected operating expenses.
CMA Data does not certify or guarantee future results. It is a professional assessment based on stated assumptions. A Chartered Accountant can help entrepreneurs translate their flour mill project into a bank-ready CMA package with internal consistency across all financial statements. For details, see CMA Data Preparation Services.
DSCR Calculation for Specialty Flour Manufacturing Plants
The Debt Service Coverage Ratio measures whether a project’s cash accruals can service term loan obligations. Banks examine year-wise DSCR and average DSCR over the repayment period. According to RBI-backed guidelines, average DSCR of 1.20 or above is often expected for manufacturing sectors, with many banks preferring 1.4–1.5 for comfort.
DSCR Formula
DSCR = (Profit After Tax + Depreciation + Term Loan Interest) ÷ (Term Loan Principal Repayment + Term Loan Interest)
Depreciation is added back because it is a non-cash charge. Principal repayment refers only to the term loan instalment scheduled for that year. Some lenders may adopt slightly modified formulas, so promoters should confirm the specific definition with their banker.
Practical DSCR Calculation Example
| Component | Year 3 (₹ Lakh) |
|---|---|
| Profit After Tax | 20.0 |
| Add: Depreciation | 12.0 |
| Add: Term Loan Interest | 8.5 |
| Total Cash Accrual for Debt Service | 40.5 |
| Term Loan Principal Repayment | 18.0 |
| Term Loan Interest | 8.5 |
| Total Debt Service | 26.5 |
| DSCR | 1.53 |
Year-Wise and Average DSCR
| Year | PAT (₹ L) | Depreciation (₹ L) | TL Interest (₹ L) | Principal (₹ L) | DSCR |
|---|---|---|---|---|---|
| 1 (Moratorium) | -2 | 14 | 12 | 0 | N/A |
| 2 | 10 | 13 | 10 | 18 | 1.18 |
| 3 | 20 | 12 | 8.5 | 18 | 1.53 |
| 4 | 28 | 11 | 7 | 18 | 1.84 |
| 5 | 34 | 10 | 5.5 | 18 | 2.11 |
Average DSCR (Years 2–5) = Total cash accruals ÷ Total debt service = 178.5 ÷ 132.0 = 1.35
Year 1 DSCR is not computed here because principal repayment is deferred under the moratorium. Acceptable DSCR thresholds vary by bank, loan scheme and risk profile. DSCR should be evaluated alongside current ratio, interest coverage ratio and projected net worth.
Specialty Flour Plant Loan Repayment Schedule and Means of Finance
Typical means of finance for a medium-scale specialty flour project include promoter equity (30–35% of project cost), term loan (65–70%) and margin money for working capital. Debt-equity structures of 1.5:1 to 2:1 are common for integrated mills; blending units may have slightly different ratios.
Interest during construction may be capitalised into project cost when the implementation period extends several months before commissioning. Repayment structures – equated instalments, step-up or back-ended schedules – directly impact early-year DSCR. Aggressively front-loaded repayment during ramp-up years is a frequent cause of weak DSCR.
For loan structuring guidance, see Project Finance Advisory & Loan Structuring Services.
Profitability, Break-Even Point and Financial Viability
Flour mills can achieve net profit margins of 18–24% at 70–80% capacity utilisation, though actual margins depend heavily on product mix, raw material costs and pricing power. Production capacity directly affects profitability for specialty flour manufacturers because fixed costs are spread over a larger volume at higher utilisation.
Break-even analysis determines the necessary sales volume to cover fixed costs. For a plant with annual fixed costs of ₹45 lakh and average contribution of ₹9 per kg, break-even quantity is approximately 500 MT per year – or roughly 28% capacity utilisation for a 30 TPD plant. A detailed project report should include cash flow analysis and break-even point alongside payback period and internal rate of return estimates.
Specialty flours command higher margins than standard commodity flour, but even commercially profitable projects can face liquidity problems if receivables are delayed or inventory builds up.
Sensitivity Analysis – What Happens When Project Assumptions Change?
Sensitivity analysis evaluates project performance under varying conditions for key inputs. The global flour market is projected to grow, but individual projects face price volatility in wheat, power tariff changes and competitive pressure.
| Scenario | Impact on EBITDA (Year 3) | Impact on DSCR (Year 3) |
|---|---|---|
| Base Case | ₹50 lakh | 1.53 |
| +10% Raw Material Cost | ₹32 lakh | 1.20 |
| −5% Selling Price | ₹34 lakh | 1.24 |
| Capacity Utilisation 55% (vs 70%) | ₹30 lakh | 1.14 |
| +1.5% Interest Rate | ₹50 lakh | 1.42 |
| +15 days Receivable Period | ₹50 lakh (cash flow impact) | 1.40 |
Financial models must include sensitivity analysis for key cost drivers. Corrective measures include renegotiating wheat procurement through long term contracts, introducing higher-margin product variants, optimising power usage and strengthening credit control. Banks often ask for at least one downside scenario in a flour mill business plan.
Financial Differences Between Specialty Flour Product Categories
Different specialty flours require separate revenue and cost assumptions. Multigrain atta involves multiple cereals and pulses, affecting raw material sourcing complexity and cost per kg. Fortified wheat flour has incremental cost from micronutrient premixes and quality checks but can access institutional and government supply contracts. Organic atta requires certification expenses and premium retail distribution – with potentially higher margins but stricter traceability. High-fibre atta and specialty blends often have higher packaging and branding costs but can command better contribution margins in urban markets. Even products like pasta production or baked goods derived from specialty flours represent investment opportunities worth exploring in financial models.
The flour milling market in Africa is growing at around 4.2% per year, and demand from regions including South America presents export possibilities for Indian food manufacturers, though such projections require careful validation.
Working capital differences also matter: organic and multigrain products may require higher-value inventory, while institutional fortified flour may involve longer receivable cycles.
For product-specific financial analysis, refer to the Multigrain Atta Manufacturing Plant Project Report, Fortified Wheat Flour Manufacturing Plant DPR, High-Fibre Atta Manufacturing Plant DPR, Organic Atta Manufacturing Plant DPR and Specialty Flour Blending Plant Project Report.
Common Financial Planning Mistakes in Specialty Flour Projects
- Assuming 80–90% capacity utilisation from Year 1, leading to inflated revenue that banks quickly challenge.
- Using unrealistic selling prices without considering competition from key players in the market, established brands and regional chakki mills.
- Underestimating raw material costs, power tariffs, packaging and logistics – especially for products sold beyond the local market.
- Ignoring marketing, trade schemes and retailer margins critical for building a specialty flour brand.
- Inadequate working capital provisioning that restricts wheat procurement and forces lower utilisation.
- Incorrect term-loan repayment assumptions – too short tenure or no moratorium – creating unsustainable instalments.
- Confusing accounting profit with cash flow when high receivables and inventory distort liquidity.
- Preparing financial projections without matching the milling capacity and plant layout to the product mix.
An experienced financial advisor and a structured feasibility study can help avoid these pitfalls before finalising investment decisions and loan applications.
How a Bank-Ready DPR Supports Specialty Flour Plant Financing
A Detailed Project Report outlines project objectives and scope. DPRs include technical setup, investment costs and production capacity. Banks require a DPR for loan applications in flour milling, and a DPR must cover machinery costs and raw material sourcing. DPRs help assess repayment capacity and business viability.
The core financial section should include 5–7 year projected P&L, balance sheet, cash flow, working capital assessment, DSCR analysis, break-even point and sensitivity analysis – all based on clearly stated assumptions. Developing financial projections requires evaluating raw material costs and production capacity together with the manufacturing process and market conditions. Technological advancements in milling are enhancing flour production efficiency and quality, which should be reflected in capacity and cost assumptions.
Banks value realistic stress testing over over-optimistic projections. For professional support, see Bank Finance DPR & Loan Proposal Assistance.
Why Choose CA Manish Gugliya for Specialty Flour Plant Financial Planning?
CA Manish Gugliya, FCA, DISA (ICAI), is a practising Chartered Accountant with more than 20 years of experience in project finance, DPR preparation, CMA Data, financial projections and loan structuring for manufacturing and agro-processing projects across India. Project Report Bank focuses on customised financial models and Detailed Project Reports – not generic templates – tailoring each assignment to actual plant capacity, product mix, location and funding structure.
Specific expertise includes total cost estimation, means of finance planning, working capital assessment, DSCR analysis, profitability evaluation and sensitivity analysis for flour mill projects and other food processing ventures.
Planning to establish a specialty flour manufacturing plant? Contact CA Manish Gugliya for project-specific DPR, CMA Data, financial projections, DSCR analysis and bank loan proposal assistance – preferably through WhatsApp, with calling as an alternative. For an overview of services, visit Financial Projections & Financial Modelling Services and Project Feasibility Study Services.
Frequently Asked Questions
Below are answers to practical questions frequently asked by entrepreneurs planning specialty flour manufacturing projects in India.
How are financial projections for a specialty flour plant actually prepared in practice?
The process starts with defining installed capacity and product mix, collecting local wheat and packaging cost data, benchmarking selling prices through market surveys and estimating all manufacturing and administrative expenses. These operational inputs are then used to build linked P&L, balance sheet, cash flow and loan repayment schedules over 5–7 years. The executive summary and financial analysis sections of the business plan should reflect these integrated assumptions.
What information should I collect before approaching a CA for a flour mill DPR?
Prepare details on proposed location, tentative capacity (TPD), target flour products, preliminary machinery quotations, approximate construction costs, expected selling channels, raw material sources, existing banking history and your investment goals. This helps the advisor prepare a meaningful feasibility study rather than working with generic benchmarks.
Can the same financial model be adapted later for plant expansion or product diversification?
A well-structured model can usually be extended for additional capacity, new product lines (for example, adding maize flour or specialty products for food processing clients) or revised funding structures by updating key factors and assumptions, provided the underlying logic and checks remain intact.
How often should specialty flour plant projections be updated once operations start?
Projections should be revisited at least annually – or whenever major changes occur in capacity utilisation, product mix, wheat prices, interest rate, financing terms or the regulatory environment. This ensures both management and banks work with current numbers for long term sustainability.
Is it necessary to have a Detailed Project Report if I am only taking a small bank loan?
Even small specialty flour units – including a mini flour mill or wheat milling plant – benefit from basic financial projections and working capital assessment. Many banks increasingly expect at least a simplified project report and CMA Data for loans above certain thresholds. A structured document demonstrates seriousness and helps the promoter understand the financial feasibility of the business before committing capital.