
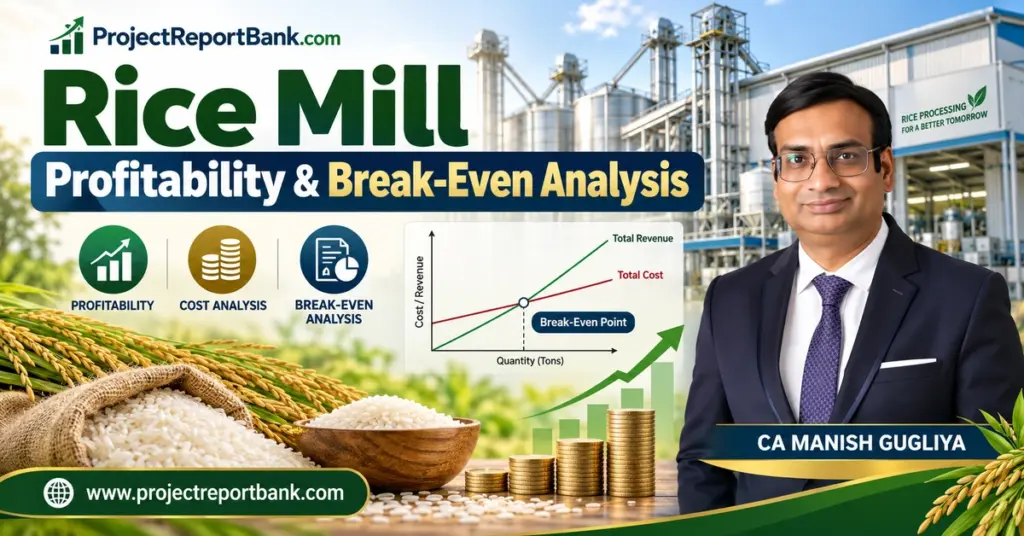
Rice mill profitability is not determined by the selling price of rice alone. It is shaped by paddy procurement cost, recovery percentage, by-product income, capacity utilisation, operating efficiency and financing structure. This article provides a practical, DPR-oriented framework for entrepreneurs, investors and lenders to evaluate whether a rice milling project is financially viable in India.
Key Takeaways
- Rice mill profitability depends on paddy procurement cost, rice recovery percentage, by-product realisation, operating efficiency and financing structure – not just the selling price of milled rice.
- Modern commercial rice mills in India can be profitable when capacity utilisation is strong (typically 55–70% and above), working capital is controlled and the production process is efficiently managed.
- Rice mill break-even analysis focuses on fixed cost, variable cost and contribution margin to determine at what annual tonnage and capacity utilisation level the mill starts covering all operating expenses.
- Rice mill profit per tonne or per quintal is always project-specific and must be derived from a proper DPR, financial projections and sensitivity analysis rather than generic internet percentages.
- A professionally prepared rice mill DPR by CA Manish Gugliya on ProjectReportBank.com helps entrepreneurs, investors and banks objectively evaluate project viability, DSCR, ROI, IRR and payback period.
Understanding Rice Mill Profitability
Rice mill profitability measures the ability of a rice milling business to generate sustainable operating profit, net profit and cash flows from processing paddy into processed rice and by-products. It is important to distinguish between profit metrics:
- Gross Profit: Sales minus cost of goods (paddy, packing, direct processing).
- Operating Profit (EBIT): Gross profit minus all operating expenses including salaries, repairs and administrative overheads.
- EBITDA: Operating profit before depreciation and amortisation – reflects core operational performance.
- Profit Before Tax (PBT): EBITDA minus depreciation and interest.
- Net Profit: PBT minus income tax.
- Cash Profit: Net profit plus depreciation and other non-cash charges – the actual cash available for loan repayment and reinvestment.
In the rice milling industry, gross margin may appear attractive because by-product income supplements head rice revenue. However, rice milling can be a thin-margin business due to high operating costs, heavy finance cost, depreciation on modern machinery and working capital interest that compress net profit. Net profit margins for rice mills can range from 5–10% in many commercial operations, though well-managed, higher-scale mills have reported net profit margins between 18–28% under favourable conditions. Initial investment for a mini rice mill starts at around ₹2–3 lakhs, but commercially viable industrial mills require substantially higher capital. For lenders, a proper rice mill profitability analysis always combines profit and loss, cash flow and balance sheet projections rather than relying on a single margin percentage.
Is Rice Mill Business Profitable in India?
Rice milling can be a commercially viable business in India when paddy procurement, plant efficiency, capacity utilisation, working capital and market realisation are handled professionally. Rice is a staple food, guaranteeing consistent market demand across the country.
Rice mill profit margin in India varies with location (Punjab, Chhattisgarh, Odisha, West Bengal, Andhra Pradesh), type of rice (non-basmati vs basmati), processing capacity and automation level. Rice mill business profitability is usually stronger when:
- Paddy procurement is efficient, close to mandis or farmers
- Rice recovery percentage is healthy with low breakage
- By-product income from bran, husk and broken rice is fully captured
- Capacity utilisation moves above the break-even point
- Power, labour and maintenance costs are disciplined
- Financing structure is balanced with reasonable term loan and working capital limits
Avoid assuming fixed profit percentages. Every rice mill project profitability analysis must be based on its own DPR assumptions and local conditions. Integrated, modern and automatic rice mills may show better rice milling profit margin due to improved recovery and lower labour intensity, but only when run at planned throughput.
Major Revenue Sources of a Rice Mill
Rice mill revenue and profitability come from multiple product streams – not from head rice alone. A realistic rice mill revenue model and product mix must account for all saleable outputs.
| Product | Illustrative Output Share | Revenue Role |
|---|---|---|
| Head (white) rice | 60–67% | Primary revenue driver; price depends on variety, grade, polish |
| Broken rice | 8–12% | Sold for food, feed, industrial use; custom milling fees range from $15–40 per tonne |
| Rice bran | 3–6% | Sold to solvent extraction plants for oil |
| Rice husk | 18–22% | Used as boiler fuel or sold to biomass users |
By-products of rice milling include bran, broken rice, and husk. By-product revenue can account for 15–25% of total gross revenue and can contribute $150,000–200,000 annually at 25 TPD scale. Ignoring this income significantly understates rice mill business profit.
Paddy Procurement and Its Impact on Profitability
Paddy procurement costs account for 70% to 80% of total operating costs, making it the single largest determinant of rice mill cost of production. A $10/tonne improvement in paddy price can save $75,000 annually for a medium-scale mill.
Key procurement factors affecting profitability:
- Seasonal price fluctuations and MSP-driven government policy in major rice-growing states
- Moisture content: high moisture leads to weight loss during drying and increased operational costs
- Quality parameters: variety, grain size, chalkiness and impurity levels directly affect recovery
- Transport distance from mandi to mill and loading costs
- Working capital locked in paddy stock during harvest season increases interest burden
An effective DPR should include a paddy procurement calendar, expected purchase prices and average holding period. For detailed guidance, refer to the guide on paddy procurement and raw material planning for rice mill.
Rice Recovery Percentage and Profitability
Rice recovery percentage – the proportion of head rice, broken rice, bran and husk obtained from paddy – directly determines rice mill yield and profitability. Head rice recovery is the primary profit driver in rice milling. Modern mills typically yield 65% to 70% whole kernel recovery.
Illustrative example (indicative only): For 1,000 tonnes of paddy processed, a modern mill might recover approximately 650 tonnes of head rice, 100 tonnes of broken rice, 50 tonnes of bran, 180 tonnes of husk, with 20 tonnes as processing loss. Each component carries different price, and even a 1–2 percentage point change in head rice yield, multiplied over tens of thousands of tonnes annually, significantly alters rice mill profit per ton and annual EBITDA. At 85% head rice yield instead of target, a mill can lose approximately $66,000 per year in revenue.
Effective quality control practices can increase the selling price of milled rice. Higher recovery is associated with better machinery, correct process settings and skilled operations.
Rice Milling Process Efficiency and Profitability
The efficiency of the rice milling production process affects throughput, rice quality, energy consumption and labour requirement. Modern rice milling technology improves efficiency and grain quality across cleaning, destoning, dehusking, polishing, grading and colour sorters stages. Modern technology reduces wastage in rice milling operations and automated systems can track every kilogram of paddy processed.
A well-balanced process with minimal bottlenecks helps achieve higher production efficiency and lower processing cost per ton. For a detailed overview, see the rice milling process flow chart and production process.
Plant Capacity and Capacity Utilisation
Installed capacity (for example, 4 TPH or 8 TPH) represents theoretical maximum output. Rice mill profitability depends on how much of this capacity is actually used across the year through sufficient operating days and shifts.
Fixed costs per tonne decline as capacity utilisation increases. A mill operating 200 days generates 33% less profit than one operating 300 days. A rice mill operating 300 days per year can generate significant revenue by spreading depreciation, salaries and interest over higher production volume. A realistic break-even analysis must consider ramp-up over the first 2–3 years rather than assuming full utilisation from day one. For structured planning, see the guide on rice mill capacity planning and production capacity.
Rice Mill Cost Structure
A proper rice mill cost and profit analysis requires separating costs into variable and fixed categories – essential for break-even calculations, contribution margin computation and DSCR analysis.
Variable Costs
- Paddy procurement: paddy purchase price is the largest variable cost in rice milling
- Packing material: PP bags, BOPP bags, stitching thread
- Electricity and fuel linked to milling operations – energy consumption is a significant operational cost in rice milling
- Consumables: rubber rolls, polishing stones, lubricants, filters
- Production-linked labour: wages of casual staff per shift; a 25 TPD rice mill typically requires 6–10 staff
- Transportation and handling per tonne where borne by the mill
Fixed and Semi-Fixed Costs
- Salaries of managerial and supervisory staff
- Administrative expenses, insurance, compliance costs
- Fixed electricity charges (minimum demand charges)
- Depreciation on building and plant & machinery
- Interest on term loan and working capital
- Rent or lease costs where applicable
A 25 TPD rice mill incurs fixed costs of approximately $500–700 daily. Correct classification enables accurate break-even sales, break-even production and margin of safety estimation.
Machinery Cost and Its Effect on Profitability
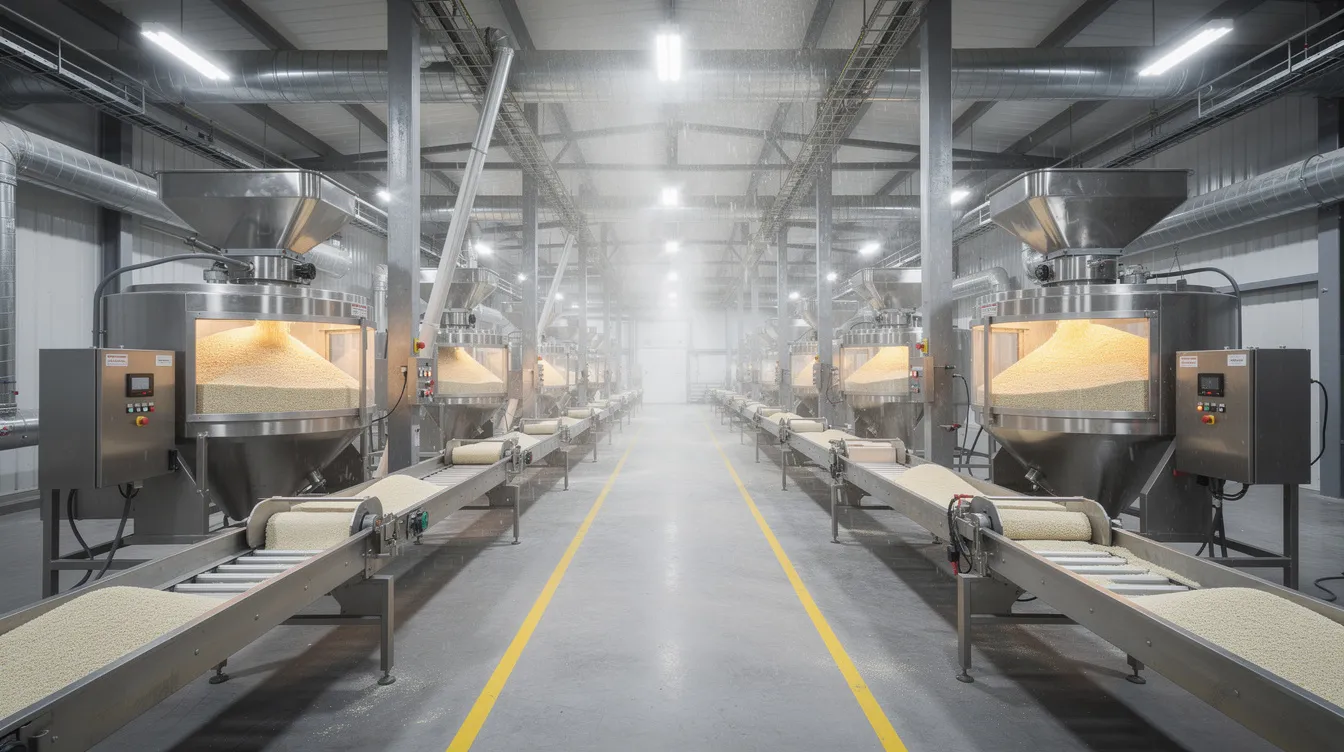
Automated machinery can enhance milling efficiency and reduce grain breakage. Automation in rice milling offers faster returns on investment through improved recovery, lower labour intensity and better rice quality consistency. However, higher-capital modern machines carry greater depreciation and interest burden.
The trade-off is clear: a conventional mill with lower initial investment may have higher per-tonne processing cost and lower recovery, while a modern plant with colour sorters and advanced polishing equipment commands higher capital but delivers better margins and competitive advantage in the market. Machinery configuration must align with targeted capacity, product quality and market positioning. For cost benchmarks, refer to the guide on rice mill machinery and equipment cost in India.
Land, Building and Plant Layout Considerations
Land and building investment affects project cost, interest during construction and project ROI. Key layout factors include adequate paddy storage, logical process flow from intake to dispatch, separate storage for bran and husk, provision for utility areas and future expansion. Over-investment in civil structures depresses IRR; cramped layouts reduce effective capacity utilisation and increase handling losses. For detailed guidance, see rice mill land, building and plant layout requirements.
Paddy Storage Cost and Inventory Economics
Paddy is harvested seasonally while milling and sales continue year-round, making storage and inventory planning critical. Paddy must be stored optimally to prevent losses from moisture and pests. Decisions on bulk seasonal procurement versus smaller regular purchases affect working capital, interest cost and the ability to benefit from harvest-season price dips. A well-prepared DPR should include an inventory holding policy with working capital interest calculations. Detailed technical options are covered in the guide on paddy storage, warehouse and silo requirements for rice mill.
Project Cost and Means of Finance
Rice mill project cost typically includes land, building, plant and machinery, electricals, pre-operative expenses and working capital margin. How this cost is financed – equity, term loan, subsidies – determines interest burden, DSCR and promoter’s return on equity.
A project with good EBITDA margin may still yield modest equity returns if over-leveraged. A rice mill can achieve payback in 2.5–4 years at medium scale; a 25 TPD mill specifically can achieve payback of approximately 2.8 years under favourable conditions. Balanced capital structure with realistic promoter contribution is essential. For deeper insights, see rice mill project cost and means of finance.
Integrated Rice Mill Project Cost and Scale Economics
An integrated rice mill combines modern milling with grading, colour sorting, packaging and by-product utilisation (husk power, bran for oil extraction). Such facilities can develop economies of scale – lower fixed cost per tonne, better bargaining power with supply chain and demand-side partners, and more efficient by-product monetisation.
However, they require higher investment running into several crores, higher working capital and strong management. An integrated rice mill investment analysis must carefully assess the procurement catchment area and market network. For promoters evaluating large plants, see the guide on integrated rice mill plant setup cost in India.
How to Calculate Rice Mill Profitability
A structured rice mill financial analysis involves projecting revenue, costs and profit for at least 7–10 years. The following illustrative example demonstrates the methodology using hypothetical data only:
| Parameter | Illustrative Annual Figure |
|---|---|
| Paddy processed | 30,000 tonnes |
| Raw material cost | ₹45.00 crore |
| Head rice output (65%) | 19,500 tonnes |
| Head rice revenue (₹28,000/tonne) | ₹54.60 crore |
| Broken rice revenue | ₹4.20 crore |
| Bran + husk revenue | ₹3.80 crore |
| Total revenue | ₹62.60 crore |
| Variable processing cost | ₹4.50 crore |
| Total variable cost | ₹49.50 crore |
| Fixed operating cost | ₹3.20 crore |
| EBITDA | ₹9.90 crore |
| Depreciation | ₹1.80 crore |
| Interest | ₹2.10 crore |
| PBT | ₹6.00 crore |
All figures are purely illustrative. Actual rice mill profit margin in India must be calculated from a project-specific DPR using contemporary market data. Professional rice mill financial projections also factor in income tax, GST, loan repayment schedules and working capital interest.
Rice Mill Profit Per Ton
Profit per tonne equals total annual operating profit divided by total tonnes processed or sold. Specify whether you measure per tonne of paddy processed or per tonne of finished rice – these are fundamentally different metrics since a tonne of paddy yields less than a tonne of rice. Generic online claims of fixed per-tonne profits are misleading without knowing paddy cost, recovery, capacity utilisation, scale and financing.
Rice Mill Profit Per Quintal
Many Indian farmers, traders and mill owners think in quintals (1 tonne = 10 quintals). Profit per quintal follows the same formula – total annual operating profit divided by total quintals processed or sold. Distinguish between profit per quintal of paddy processed and profit per quintal of rice sold. A DPR should express profitability in both per-tonne and per-quintal terms for all stakeholders.
What Is Break-Even Analysis in a Rice Mill?
Rice mill break-even analysis identifies the production volume or sales level at which total revenue equals total cost – no profit, no loss. Core definitions:
- Fixed Cost: Costs that do not vary significantly with tonnage (salaries, interest, depreciation)
- Variable Cost: Costs that change with production (paddy, packing, energy, consumables)
- Contribution per unit: Selling price per unit minus variable cost per unit
- Contribution Margin Ratio: Contribution ÷ Sales
Formulas:
- Break-Even Sales (₹) = Fixed Costs ÷ Contribution Margin Ratio
- Break-Even Production (tonnes) = Fixed Costs ÷ Contribution per Tonne
Rice Mill Break-Even Calculation – Illustrative Example
| Parameter | Illustrative Value |
|---|---|
| Effective annual capacity | 36,000 tonnes paddy |
| Annual fixed costs | ₹3.20 crore |
| Average selling price per tonne (blended) | ₹20,867 |
| Variable cost per tonne | ₹16,500 |
| Contribution per tonne | ₹4,367 |
| Contribution Margin Ratio | 20.9% |
| Break-even production | ~7,327 tonnes |
| Break-even sales | ₹15.29 crore |
| Break-even capacity utilisation | ~20.4% |
All values are indicative. Industry DPRs report break-even capacity utilisation ranging from 28% to 50% depending on scale, cost structure and product mix. Actual figures must be computed from project-specific data.
Break-Even Capacity Utilisation
Break-even capacity utilisation is the percentage of effective plant capacity at which the rice mill covers all operating costs. If effective annual capacity is 60,000 tonnes and break-even output is 30,000 tonnes, break-even capacity utilisation is approximately 50%.
During initial years, mills may operate below break-even and require promoter support. Reaching utilisation above break-even is critical for timely loan servicing and acceptable DSCR. Promoters should plan procurement, marketing and staffing to achieve break-even utilisation within 12–24 months of commissioning.
Margin of Safety
Margin of safety measures how much projected sales exceed break-even sales:
- Margin of Safety (₹) = Projected Sales – Break-Even Sales
- Margin of Safety (%) = Margin of Safety ÷ Projected Sales × 100
A low margin of safety (sales just 5–10% above break-even) indicates higher risk from adverse paddy price or demand changes. Banks look more favourably at projects with comfortable margin of safety under base-case assumptions.
EBITDA Margin in a Rice Mill
EBITDA margin (EBITDA ÷ Sales) reflects core operating profitability before financing and non-cash charges. A mill may show healthy EBITDA due to good recovery and cost control but end up with slender net profit because of heavy term loan interest and high depreciation. Another mill with moderate EBITDA but low debt may display stronger net profit. EBITDA margin is useful for comparing operating performance, but DSCR, cash accrual and net profit remain essential for debt-servicing assessments.
Working Capital and Its Effect on Profitability
Rice milling is working-capital-intensive. Paddy inventory (weeks or months of consumption), finished rice stock, receivables from traders and export customers all tie up funds. Inadequate working capital causes under-utilisation of capacity – paddy cannot be purchased in time – reducing operating profit despite a fundamentally profitable model. High working capital borrowings increase interest and reduce net profit margin and DSCR. The DPR should contain a separate working capital assessment with seasonal procurement profile.
Sensitivity of Rice Mill Profitability
Rice mill profitability is highly sensitive to a few critical input variables. A bankable DPR must test scenarios such as:
| Sensitivity Factor | Impact on EBITDA/Net Profit |
|---|---|
| Paddy price +5% | Significant reduction in contribution and profit |
| Rice selling price −5% | Direct compression of margins |
| Head rice recovery −2% | Lower revenue, higher broken rice share |
| Capacity utilisation −10 pp | Higher fixed cost per tonne |
| Power tariff increase | Higher variable cost per tonne |
| Interest rate +1% | Higher finance cost, lower PBT and DSCR |
This exercise helps promoters and lenders understand which factors require the closest monitoring.
Key Profitability Drivers
| Profitability Driver | Positive Impact | Negative Impact |
|---|---|---|
| Paddy cost and quality | Lower cost, better grain quality → higher recovery | High MSP, poor quality → lower margins |
| Rice recovery % | Higher head rice yield → more revenue per tonne | Low recovery → revenue loss at scale |
| By-product realisation | Bran, husk, broken rice income supplements turnover | Ignored or unsold → lost revenue |
| Capacity utilisation | Spreads fixed costs → better margins | Low utilisation → losses |
| Energy efficiency | Husk-based power reduces grid cost | High tariff → cost pressure |
| Labour productivity | Fewer staff per tonne with automation | Excess labour → inflated costs |
| Selling price and product mix | Premium grades, export, branded packs | Commodity pricing, no differentiation |
| Working capital cycle | Shorter cycle → lower interest | Long cycle → higher finance cost |
| Finance cost and leverage | Low debt → higher net profit | Over-leveraged → cash stress |
Systematic improvement across these drivers enhances rice mill ROI, IRR and long-term sustainability.
Profitability of Modern vs Conventional Rice Mills
Modern automated mills with pre-cleaners, de-stoners, advanced huskers and colour sorters offer higher efficiency: improved head rice recovery, better grading, reduced manual labour and higher throughput per hour. However, they carry higher machinery cost, depreciation and maintenance needs requiring skilled technicians. Automation does not guarantee higher rice milling profit margin unless capacity utilisation, paddy supply and market access are strong. Promoters should compare life-cycle cost and expected EBITDA margin for both solutions in a feasibility study before choosing technology level.
Profitability of an Integrated Rice Mill
An integrated rice processing plant incorporating cleaning, milling, grading, sorting, packaging and by-product handling offers better value addition, more stable income streams and improved bargaining power through scale. However, integrated mills involve higher capital outlay and complex operations. They must pay attention to market segmentation (domestic bulk, retail, export), logistics cost and quality control at each stage. The rice mill project report for integrated units must capture combined profitability of rice, by-products, power and packaging. Strategic planning and rigorous market analysis are essential before commitment.
How Banks Assess Rice Mill Profitability
Banks examine rice mill proposals by reviewing DPRs, projected financial statements and promoter credentials. Key evaluation points include:
- Projected revenue and profitability under realistic assumptions
- Cash accrual sufficient for term loan repayment
- DSCR over the loan tenure (typically 1.5–1.8 under base case)
- Break-even point and margin of safety
- Debt-equity ratio and promoter contribution
- Working capital requirement and security cover
A professionally prepared DPR by a Chartered Accountant presents assumptions, financial projections, project viability and repayment capacity for consideration by lenders – it does not guarantee performance. Banks also request sensitivity analysis before sanctioning finance.
Common Mistakes in Rice Mill Profitability Estimates
Frequent mistakes in rice mill project reports include:
- Ignoring broken rice percentage and assuming all output sells as head rice
- Not including by-product income from bran and husk
- Assuming 80–90% capacity utilisation in the very first year
- Ignoring seasonal paddy price fluctuations and storage losses
- Underestimating working capital requirement and interest cost
- Omitting freight, packaging and marketing expenses
- Using selling prices above prevailing market rates
- Assuming constant recovery regardless of paddy source and season
- Confusing gross profit with net profit
Such mistakes overstate rice mill business profitability and create problems during implementation and loan repayment.
Rice Mill Profitability in a Detailed Project Report
A comprehensive DPR is the primary tool for communicating rice mill project viability. It should contain: project cost and means of finance, production programme with capacity utilisation build-up, raw material procurement strategy, revenue assumptions with product mix and by-product income, operating cost estimates, projected profit and loss, balance sheet, cash flow, working capital assessment, break-even analysis, ROI, IRR, DSCR and sensitivity analysis. These components must be interconnected – capacity utilisation in the production schedule must align with revenue and cost numbers in financial projections.
Why Generic Rice Mill Profit Percentages Can Be Misleading
Rice mill profit margins in India are generally quoted at 5–10% online, but no universal margin applies across all projects. A credible analysis requires project-specific data: location, mill capacity, paddy variety, purchase price, recovery rate, product mix, by-product monetisation, financing pattern and operating days per year. Two mills with identical machines but different paddy prices and selling price realisation will show entirely different net profit margin and payback period. Serious entrepreneurs should rely on project-specific DPRs rather than generic estimates before committing crores to a rice milling project.
Professional DPR and Financial Feasibility Support
CA Manish Gugliya is a practising Chartered Accountant (FCA, DISA (ICAI)) with extensive experience in preparing project reports, DPRs and financial analyses for industrial projects including rice mills across India. Core services include:
- Bank finance DPR and investor-ready project reports
- Detailed rice mill financial projections and CMA data
- Project feasibility and viability studies
- Break-even analysis, DSCR evaluation, ROI, IRR and payback analysis
- Working capital assessment and cash-flow planning
- Advisory on project cost and means of finance structuring
A professionally prepared rice mill project report helps promoters understand profitability drivers and risks, banks assess repayment capacity, and investors evaluate return possibilities.
CA Manish Gugliya, FCA, DISA (ICAI) Project Report, DPR & Financial Feasibility Consultant www.projectreportbank.com

Frequently Asked Questions
Is rice mill business profitable in India?
Rice milling can be profitable at commercial scale with efficient paddy procurement, realistic capacity utilisation, proper by-product monetisation and disciplined cost control. Profitability differs between small, medium and integrated mills. A project-specific DPR is necessary – no guaranteed profit rate applies universally.
What is the average profit margin of a rice mill?
There is no single average profit margin applicable to all rice mills. Margins vary with paddy price, recovery, automation, scale, financing and product mix. Promoters should build a detailed financial model showing gross margin, EBITDA margin and net profit margin for their specific project.
How is the break-even point of a rice mill calculated?
Break-even sales (₹) equals fixed costs divided by contribution margin ratio. Break-even output (tonnes) equals fixed costs divided by contribution per tonne. The mill must first estimate annual fixed costs, average blended selling price and average variable cost per tonne. A break-even worksheet should be part of every rice mill DPR.
How much profit can a rice mill earn per tonne or per quintal?
Profit per tonne or per quintal depends entirely on project-specific data – paddy cost, recovery, by-product realisation, capacity utilisation, finance cost. Online claims of fixed per-tonne profits should be treated as rough illustrations, not reliable planning inputs. The DPR should show a full cost build-up transparently.
What financial ratios should be analysed before setting up a rice mill?
Key ratios include EBITDA margin, net profit margin, ROI, IRR, DSCR over loan tenure, break-even capacity utilisation and current ratio. Analysing these for base-case and stressed scenarios helps promoters and lenders judge whether the project has acceptable financial strength. A professionally prepared DPR from ProjectReportBank.com provides all these ratios in a structured, bank-compliant format.