

Key Takeaways
- Value-added dairy plant financial projections convert the technical concept of a dairy processing unit (paneer, curd, yogurt, lassi, Greek yogurt, probiotic products) into measurable, bank-appraisable numbers for a detailed project report. Banks in India expect integrated 5-year financial projections covering product-wise revenue, cost of production, working capital, term-loan repayment, DSCR, break-even, ROI and IRR, all grounded in realistic capacity utilisation and milk procurement assumptions.
- The financial model must be built bottom-up: from installed capacity to production volume, then to sales, revenue, direct and indirect costs, EBITDA, interest, depreciation, profit after tax, cash accrual, and finally debt servicing. Arbitrary percentage-based growth projections without operating logic are routinely questioned by credit officers during loan appraisal.
- All numbers used in this article are purely illustrative. Actual dairy plant profitability depends on product mix, raw milk cost, technology, location, market positioning, and financing structure. No financial projection should be treated as a guarantee of returns.
- This article is written in the professional voice of CA Manish Gugliya (ProjectReportBank.com), focusing on bank-ready DPRs, dairy processing project finance, and decision making for entrepreneurs, MSMEs, and dairy sector investors across India.
Introduction: Why Financial Projections Matter in a Value-Added Dairy Plant DPR
Financial projections for a value-added dairy plant translate a dairy processing idea into measurable outcomes that lenders, investors, and promoters can evaluate. When a promoter submits a dairy processing plant DPR to a bank, the financial model is the section that determines whether the project is worth funding. India’s dairy industry output grew from 146.30 million tonnes in 2014 to 239.30 million tonnes in 2023, and this growing demand has made value-added dairy processing one of the most actively financed segments in food manufacturing. A detailed project report is mandatory for loan approval, and the financial projections within it carry the heaviest weight during credit appraisal.
Banks examine revenue projections, cost of production, EBITDA, net profit, cash accrual, working capital requirement, term-loan repayment capacity, the debt service coverage ratio, break-even utilisation, ROI, and IRR. Each of these metrics must flow logically from the operating assumptions stated in the DPR. Unlike a simple dairy farm project report focused primarily on milk production and calf sales, a value-added dairy processing DPR centres on milk conversion into paneer, curd, yogurt, lassi, Greek yogurt, probiotic products, and other packaged dairy products.
Projections must be grounded in realistic assumptions on capacity utilisation, milk price, product mix, selling prices, distributor margins, and cold-chain logistics. Banks routinely discount optimistic “desktop” models that assume full capacity from day one or ignore seasonal milk-price fluctuations. A well-structured project report reduces loan rejection risks and gives the promoter a clear picture of what needs to go right for the project to succeed.
What Are Value-Added Dairy Plant Financial Projections?
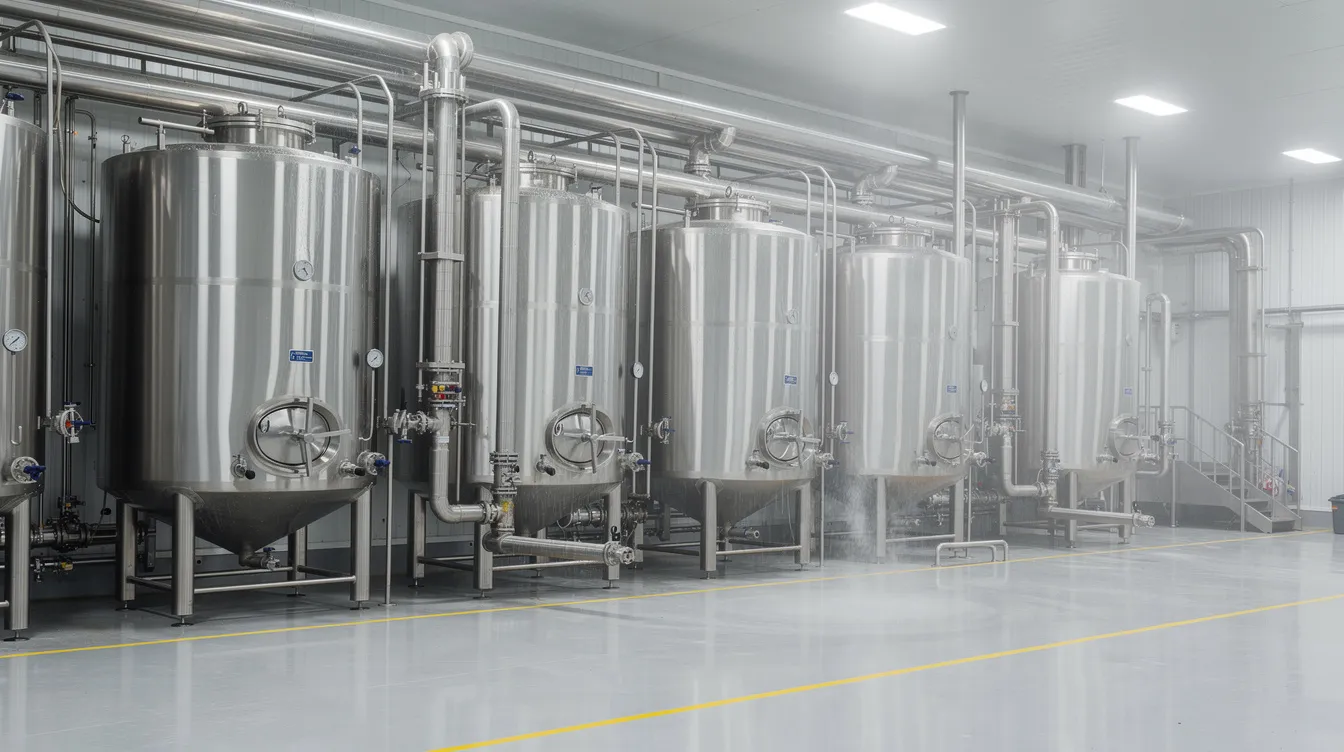
Financial projections in the context of a paneer, curd, yogurt, lassi, Greek yogurt, and probiotic dairy plant are modelled estimates over 5 to 7 years showing how the unit will perform financially. They link dairy farming (the supply side) with dairy processing (the conversion and marketing side) into one coherent value chain analysis. Creating financial projections for value-added dairy plants requires accounting for agricultural supply chain dynamics and manufacturing economics simultaneously.
A dairy plant financial model connects installed capacity in litres per day to product-wise production volume, then to sales quantity, sales value, cost of raw milk and ingredients, manufacturing overheads, EBITDA, interest and depreciation, profit after tax, and cash accrual. The full chain runs as: Capacity → Production → Sales → Revenue → Direct Costs → Overheads → EBITDA → Interest → Depreciation → Profit → Tax → Cash Flow → Debt Servicing. Dairy processing can create multiple revenue streams beyond raw milk sales, and the financial projections must capture this diversification. Research across European dairy markets has shown that processing milk into cheese can increase profit margins by €0.688 per litre, illustrating why value-addition is worth modelling carefully.
These dairy plant financial projections for DPR are not a stand-alone spreadsheet. They are an integrated part of the dairy processing plant DPR covering technical, market, and financial feasibility. Banks use them to evaluate dairy plant financial viability, loan repayment capacity, and the promoter’s ability to manage cash flow under realistic operating conditions.
Key Operating Assumptions Before Building the Dairy Plant Financial Model
Robust value-added dairy plant financial projections start with clear, written assumptions agreed between the promoter and the consultant. Every figure in the projected profit and loss account, balance sheet, and cash flow statement traces back to these assumptions. Key factors influencing financial projections include capital expenditures and raw milk procurement costs, and getting these wrong cascades errors through the entire model.
Installed processing capacity is the starting point. For example, a plant rated at 50,000 LPD specifies how much raw milk goes into paneer, curd/dahi, yogurt, lassi, Greek yogurt, and probiotic products. This allocation drives the rest of the projections. At the farm level, dairy farm operating costs are 60-70% feed-related, and these feed costs ultimately influence the milk price that the processing plant must pay.
Product mix matters because the split between bulk curd, cup yogurt, Greek yogurt, lassi, and paneer significantly alters gross margin, packaging cost, and distribution requirements. Product mix optimization is necessary due to the different yields and margins associated with various dairy products.
Capacity utilisation ramp-up is critical. A new dairy processing unit in India rarely crosses 85-90% utilisation in early years. Facility capacity and utilization rates are critical in determining dairy plant operating costs and profitability.
| Year | Illustrative Capacity Utilisation |
|---|---|
| Year 1 | 55%–65% |
| Year 2 | 65%–75% |
| Year 3 | 75%–85% |
| Year 4 | 80%–90% |
| Year 5 onward | Stabilised level |
Actual utilisation assumptions must be project-specific based on market reach, distribution network, and brand strength.
Milk procurement cost is the single most sensitive variable. Cow milk prices range from ₹40 to ₹80 per litre based on breed, fat/SNF content, and region. Recent surveys in southern India show farm-gate production cost of roughly ₹28–₹32 per litre for indigenous breeds and ₹18–₹20 for crossbred cattle. Seasonal variation between flush and lean seasons must be modelled, not averaged away.
Product selling prices vary sharply across channels. Institutional bulk packs carry lower realisations than consumer retail packs. Modern retail and HoReCa channels often demand higher trade margins and promotional spending. Projections should use conservative, market-validated pricing with explicit allowance for distributor and retailer margins.
Yield and process loss assumptions are essential for realistic value-added dairy project financial analysis. The litres of milk required per kg of paneer, per kg of Greek yogurt, or per litre of set curd determine how much raw material cost is embedded in each finished product. Whey handling, fermentation losses, and packaging wastage must be factored in.
Working-capital assumptions complete the picture: credit period allowed to distributors (often 15–30 days), inventory holding of raw milk (near-zero), packaging materials (15–30 days), ingredients, and finished goods (varies by product shelf life), plus supplier credit terms for milk and packaging vendors.
Revenue Projections for a Value-Added Dairy Plant
Dairy plant sales and revenue projections must be built product-wise, not by applying a single blended price per litre. Revenue projections should account for product mix strategies and seasonal fluctuations in raw milk prices and availability. The core formula is: Projected Revenue = Production Quantity × Saleable Yield × Net Realisation per Unit (after trade discounts and schemes). Each major SKU family should be projected separately.
Installed capacity, operating days (typically 300–330 days per year), capacity utilisation percentage, and product-wise allocation together determine saleable quantity. Dairy farm financial models project revenue based on milk sales at the farm level, but a processing plant model must project revenue based on converted product volumes and their respective selling prices across multiple channels.
| Product | Year 1 Revenue (₹ Cr) | Year 2 Revenue (₹ Cr) | Year 3 Revenue (₹ Cr) |
|---|---|---|---|
| Paneer | 3.20 | 4.50 | 5.80 |
| Curd/Dahi | 4.80 | 6.10 | 7.50 |
| Yogurt | 2.40 | 3.40 | 4.60 |
| Lassi | 1.80 | 2.50 | 3.20 |
| Greek Yogurt | 0.90 | 1.40 | 2.00 |
| Total | 13.10 | 17.90 | 23.10 |
All figures are hypothetical and for illustration only.
Trade schemes, promotional discounts, and returns are adjusted to arrive at net sales, and banks expect this adjustment to be stated explicitly. For a deeper discussion on market-side assumptions and channel strategy, refer to the article on Value-Added Dairy Products Revenue Model & Market Strategy.
Linking Capacity Planning and Product Mix with Financial Projections
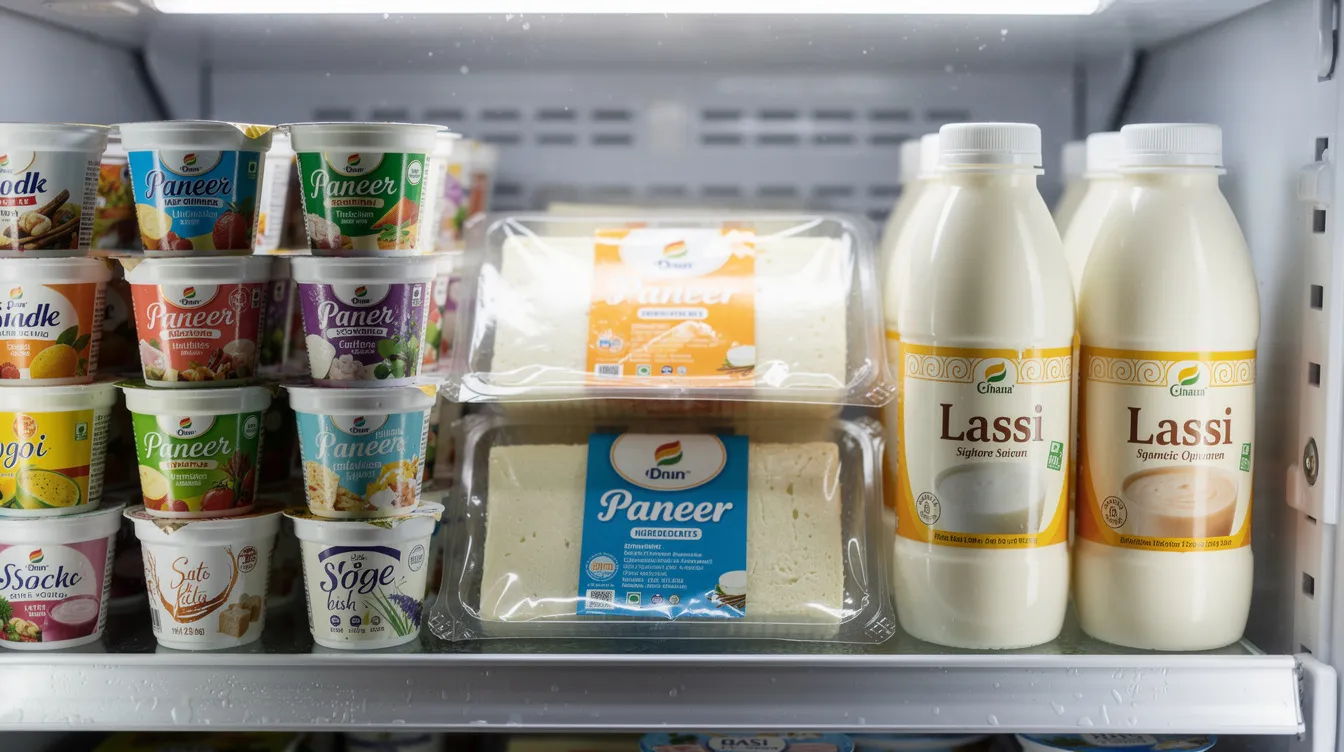
Capacity planning is the backbone of any dairy plant financial model. If the capacity and product mix logic is weak, the entire DPR becomes questionable during bank appraisal. The difference between installed capacity (for example, rated 50,000 LPD), effective capacity after CIP cleaning and maintenance downtime, and practical utilisation in the first 5 years must be clearly explained.
Allocation of capacity among products directly influences per-litre contribution and overall profitability. For instance, directing 35% of milk to curd, 25% to yogurt, 15% to paneer, 15% to lassi, and 10% to Greek yogurt and probiotic products creates a very different margin profile than a curd-heavy or paneer-heavy plant. Seasonal demand patterns also matter: lassi and flavoured milk demand peaks in summer, while ghee, paneer, and dahi consumption rises during festive and winter seasons. These cycles should reflect in quarterly or at least half-yearly projections.
Product shelf life and cold-chain limitations constrain how much finished inventory can be safely projected. Short-life products like curd and yogurt require high stock-turn assumptions and tight distribution logistics. For detailed capacity allocation methodology, see the guide on Value-Added Dairy Plant Capacity Planning & Product Mix.
Project Cost and Means of Finance in the DPR
Dairy plant project cost and profitability projections must always start from a clearly defined capital cost and means-of-finance structure. Dairy processing requires significant capital investment in machinery and regulatory compliance, and understating project cost is one of the fastest ways to get a DPR rejected.
Major project cost heads include land, site development, building and civil works, plant and machinery, utilities (boiler, chilling plant, refrigeration, compressed air), cold storage, ETP, laboratory, vehicles, electrical installations, furniture, preliminary and pre-operative expenses, contingencies, and margin money for working capital. Each capital item feeds into the financial projections: plant and machinery drive depreciation and term-loan requirement; building cost influences collateral valuation; utilities and cold rooms determine operating expenses.
NABARD requires a complete project report for subsidy applications under schemes like the Dairy Entrepreneurship Development Scheme. Other government subsidies available include PMEGP, which offers 15-35% subsidy for dairy projects up to ₹50 lakh, and NABARD’s 25% back-end capital subsidy for dairy farms, with SC/ST and women farmers eligible for 33.33% subsidy under the National Livestock Mission framework. Additionally, Mudra loans up to ₹10 lakh are available without collateral for dairy farmers, and dairy farmers can access CGTMSE collateral-free loans up to ₹5 crore.
| Component | Amount (₹ Cr) |
|---|---|
| Land & Site Development | 1.50 |
| Building & Civil Works | 3.20 |
| Plant & Machinery | 6.50 |
| Utilities & Cold Storage | 2.30 |
| ETP, Lab, Electrical | 1.00 |
| Preliminary & Pre-operative | 0.80 |
| Contingency | 0.70 |
| Margin Money for WC | 1.00 |
| Total Project Cost | 17.00 |
| Promoter Contribution (30%) | 5.10 |
| Term Loan (65%) | 11.05 |
| Subsidy (if applicable) | 0.85 |
Illustrative structure only. Actual project cost depends on capacity, location, and technology.
For a detailed cost-head breakup, refer to the guide on Value-Added Dairy Plant Project Cost & Means of Finance.
Machinery Cost and Depreciation in Value-Added Dairy Plant Financial Projections
Machinery and equipment cost influences not only capex but also dairy plant depreciation and interest calculation, thereby affecting break-even sales and DSCR. Main equipment categories include milk reception and chilling, pasteurisers, homogenisers, fermentation tanks, paneer presses, filling and packing machines, cold rooms, CIP systems, and quality-control instruments.
Accurate machinery quotations with current market prices should be used. Financial models for dairy plants must account for depreciation schedules and lifecycle costs of processing equipment. As per industry benchmarks, machinery cost for a 10,000 LPD multi-product plant ranges from ₹1.5–3.0 crore, scaling to ₹10–20+ crore for 100,000 LPD fully automated lines. CAPEX per LPD declines significantly with scale.
Depreciation schedules in the DPR must be consistent with Companies Act and Income-tax norms. Higher automation may increase depreciation but can reduce labour cost and process losses. For machine-wise capex ranges, see Value-Added Dairy Plant Machinery & Equipment Cost.
Land, Building and Utility Cost Assumptions
Land, building, and utilities layout decisions have a long-term impact on capital costs, hygiene compliance, and operational efficiency. Plot size, zoning requirements, road access, and utility connections influence land and site-development cost across different Indian states.
Typical building spaces include raw milk reception bay, processing hall, fermentation area, paneer processing room, cold rooms, packaging section, dry stores, utilities block, QC laboratory, admin area, staff amenities, and ETP. Hygienic layout with clean and unclean zones, proper product and personnel flow, and CIP routing may require additional civil investment but supports FSSAI compliance. Electricity sanction load, backup DG sets, boiler sizing, and ETP capacity must match projected processing volumes. For technical guidance, see Value-Added Dairy Plant Land, Building, Utilities & Hygienic Layout.
Manufacturing Process and Its Impact on Financial Projections
Different value-added dairy products follow different process flows, and each step impacts cost structure and yields. The paneer process affects yield (kg paneer per litre milk), whey handling, chilling requirements, and labour intensity. Fermentation time and temperature control for curd, yogurt, and probiotic products increase reliance on stainless-steel tanks, incubation rooms, and cold storage, raising power and fuel and labour cost assumptions.
Packaging speed and automation level (FFS machines, cup fillers, bottle lines) affect packaging material wastage, labour deployment, and hourly throughput. Cleaning-in-place cycles, water consumption, and sanitation practices add to chemical and utility expenses. These process-driven costs must be reflected in value-added dairy project financial analysis. For process flows and equipment details, refer to Value-Added Dairy Products Manufacturing Process & Production Line.
Projected Cost of Production for Value-Added Dairy Products
Cost of production is the heart of dairy profitability analysis. Milk procurement is often the largest operating cost in dairy processing, impacting profitability across all product lines. The cost of goods sold for dairy products includes raw milk, direct ingredients, and utilities for processing, and must be calculated per unit of finished product.
Raw milk cost typically represents 50-65% of COGS for fluid milk operations and 60-70% or more for concentrated products like paneer and Greek yogurt. Fat/SNF-based pricing, procurement from dairy farmers versus chilling centres, and seasonal variation all affect per-litre cost.
Ingredient costs include cultures, sugar, flavours, fruit preparations, stabilisers, and salt. Premium products like Greek yogurt and probiotic drinks carry significantly higher ingredient cost per unit. Packaging material cost for cups, tubs, bottles, pouches, lids, labels, corrugated boxes, and secondary packaging varies sharply between premium SKUs and bulk packs.
Utility costs (power, fuel, refrigeration, boiler fuel, chilled water, compressed air) scale with capacity utilisation and process choices. Operating expenses include salaries, marketing costs, and regulatory compliance for dairy processing plants. Labour and salary costs should be broken down by production workers, plant supervisors, quality-control staff, maintenance, admin, and sales personnel.
Repairs and maintenance, quality-control lab consumables, and CIP cleaning chemicals are recurring overheads that first-time promoters often miss. Dairy processing plants often require ongoing investment in cold chain logistics and quality assurance to meet regulatory standards. Cold-chain and distribution expenses (reefer vehicles, insulated boxes, CFA charges) can materially influence dairy-product profitability. For cold-chain cost details, see Cold Storage & Cold Chain Requirements for Value-Added Dairy Products.
Projected Profit and Loss Account
The projected profit and loss account summarises net sales, production cost, overheads, interest, depreciation, and tax over a 5-7 year horizon and is central to any dairy plant project report for bank loan. Financial statements for dairy plants should include income statements and cash flow statements to monitor performance. A dairy farm project report includes 5-year financial projections, and so does a dairy processing plant DPR.
Major P&L heads include: net sales, cost of raw materials (milk, ingredients, packaging), power and fuel, wages and salaries, manufacturing expenses, selling and distribution expenses, administrative expenses, EBITDA, depreciation, interest (term loan and working capital), profit before tax, tax, and profit after tax. Total operating expenses typically dominate the P&L, with raw milk cost alone accounting for the bulk of variable costs.
EBITDA margin alone is not sufficient. Banks look at PAT margin, cash accrual (PAT + depreciation), and DSCR to judge dairy plant financial viability. Dairy processing plant projected profit and loss should align with the revenue and cost assumptions, and banks check whether margins are comparable to industry norms. Dairy farms can achieve gross profit margins of 35-45% at the farm level, but processing plant margins vary widely based on product mix and scale.
Projected Balance Sheet for a Value-Added Dairy Plant
The dairy plant projected balance sheet shows the evolving financial position: net worth, term loan balance, working capital borrowings, fixed assets, and current assets over the projection period. It must reconcile with the projected cash flow and profit and loss statements.
Key liability-side heads include promoter capital, reserves and surplus, term loans, working-capital limits, trade creditors, other current liabilities, and provisions. Asset-side heads include gross block and accumulated depreciation, capital work-in-progress, inventories, trade receivables, cash and bank balance, loans and advances, and other current assets. Term-loan outstanding, equity build-up, and working capital usage must match across all financial statements. The dairy plant projected balance sheet for bank loan should follow a Companies Act-style format familiar to Indian bankers.
Projected Cash Flow Statement and Cash Accrual
Accounting profit and cash available for term-loan repayment are different. Banks focus on dairy plant cash flow projection to determine whether EMIs can be serviced comfortably. The cash flow statement balance sheet and P&L must all tell a consistent story.
The three main parts are: operating cash flow (from EBITDA, working-capital changes, tax), investing cash flow (capital expenditure), and financing cash flow (term-loan drawdown, repayment, interest, promoter contribution). Cash accrual (profit after tax plus depreciation) is the quick indicator of internal cash generation for debt servicing.
A positive P&L with aggressive loan repayment can still create a cash crunch. For example, a plant showing ₹1.5 crore PAT but with ₹2.2 crore annual principal repayment will face a fund flow deficit unless depreciation and working capital movements provide additional cash. This underscores the importance of realistic cash-flow planning in the DPR.
Working Capital Projection for Dairy Processing Plants
Working capital is often the most underestimated part of dairy processing project finance and can lead to liquidity stress even when the plant is technically profitable. Working capital management is essential for dairy plants due to discrepancies between cash inflows and outflows.
Working capital requirement is calculated based on holding norms: days of raw milk inventory (very low, often 1-2 days), days for ingredients and packaging (15-30 days), finished-goods inventory by product (short for curd/yogurt, slightly longer for paneer), receivables days (15-30 days for distributors), and creditors days for milk and packaging suppliers.
The difference between total working capital requirement and current liabilities excluding bank borrowing gives the working capital gap. Promoter contribution for working capital margin (typically 20-25%) plus the bank working capital limit together fund this gap. The dairy plant working capital projection must remain consistent with sales growth, credit terms, and inventory assumptions already used in revenue and cost projections.
Term Loan, Repayment Projection and Loan Schedule
Dairy plant term loan projection should capture disbursement timing during project implementation, moratorium period (typically 6-12 months for construction and stabilisation), repayment period (usually 5-7 years), interest rate, and security structure.
The dairy plant loan repayment projection specifies instalment structure (monthly or quarterly), principal amount per instalment, interest calculated on declining balance, and outstanding loan at each year-end. Current illustrative term-loan rates for dairy processing projects are around 10-10.5% depending on the bank and scheme.
Overly aggressive repayment (short tenor, large EMIs) may depress DSCR and make an otherwise viable project appear risky to lenders. A clear dairy plant loan repayment schedule must be annexed to the DPR, with closing balances reconciling with the projected balance sheet and DSCR analysis.
DSCR, Break-Even and Profitability Analysis
DSCR, break-even, and profitability ratios are core indicators in any dairy plant bank loan project report and heavily influence sanction conditions. Banks require a minimum debt service coverage ratio of 1.25 for dairy farm loans, with many schemes requiring 1.5 after sensitivity adjustments.
The formula is straightforward: DSCR = Cash Available for Debt Service ÷ Total Debt Service (interest + principal). Annual DSCR and average DSCR over the loan tenure are both computed. NDDB’s financial management guidelines specify ROI norms of at least 10% and DSCR of 1.5 or above for cooperative dairy sub-projects. In practice, DSCR may be below 1 during moratorium or early ramp-up years, but should cross 1.25 by mid-tenure.
Break-even analysis separates fixed costs (salaries, interest, depreciation, fixed utilities) from variable costs (milk, ingredients, packaging, variable power, transport) and calculates contribution per unit. Break-even utilisation levels for a well-structured dairy plant should ideally fall below 65-70% of installed capacity. A 10-cow dairy unit can reach break-even by Year 2 with setup costs of ₹10-15 lakh, but processing plants are more complex and typically require Year 2-3 for break-even depending on product mix and ramp-up.
Profitability metrics include gross margin, contribution margin, EBITDA margin, net profit margin, per-litre profit on milk handled, and per-kg margin for each product category. High selling price does not automatically mean high profitability when packaging, wastage, cold-chain expenses, and distributor margins are factored in. For deeper analysis, refer to Value-Added Dairy Plant Profitability & Break-Even Analysis.
ROI, IRR, Payback and Sensitivity Analysis
Lenders and equity investors look beyond accounting profit to economic returns such as project IRR, equity IRR, payback period, and net present value, especially for larger dairy processing projects. Project IRR measures cash-flow-based returns on total capital invested, while equity IRR focuses on the promoter’s own capital. These differ from P&L margins and should not be inflated in the DPR.
Payback period is the number of years of projected cash accrual required to recover initial promoter investment. While useful, payback alone should not be the only decision metric. Financial projections should undergo sensitivity analysis to assess risk factors such as milk price volatility and sales volume changes.
| Scenario | Impact on EBITDA | Impact on DSCR |
|---|---|---|
| Milk price +5% | ↓ 8–12% | ↓ 0.10–0.20 |
| Selling price –5% | ↓ 10–15% | ↓ 0.15–0.25 |
| Capacity utilisation –10% | ↓ 12–18% | ↓ 0.20–0.30 |
| Power cost +10% | ↓ 2–4% | ↓ 0.03–0.05 |
Illustrative directional impacts only. Actual sensitivity depends on project-specific cost structure.
Illustrative 5-Year Financial Projection Snapshot for a Value-Added Dairy Plant
The table below is a hypothetical example for a mid-sized value-added dairy plant (approximately 30,000 LPD installed capacity with a mixed product portfolio). Key assumptions include gradual capacity ramp-up, an average blended selling price of ₹55–60 per litre of milk equivalent processed, term loan of ₹11 crore at approximately 10.5% interest with 1-year moratorium and 6-year repayment. All figures are hypothetical and for illustration only; actual project results will differ.
| Parameter | Year 1 | Year 2 | Year 3 | Year 4 | Year 5 |
|---|---|---|---|---|---|
| Capacity Utilisation (%) | 55% | 68% | 78% | 85% | 88% |
| Total Revenue (₹ Cr) | 14.50 | 18.90 | 23.00 | 26.50 | 29.20 |
| Cost of Production (₹ Cr) | 12.20 | 15.30 | 18.10 | 20.40 | 22.00 |
| EBITDA (₹ Cr) | 2.30 | 3.60 | 4.90 | 6.10 | 7.20 |
| Depreciation (₹ Cr) | 1.10 | 1.10 | 1.10 | 1.05 | 1.00 |
| Interest (₹ Cr) | 1.15 | 1.00 | 0.82 | 0.63 | 0.42 |
| PBT (₹ Cr) | 0.05 | 1.50 | 2.98 | 4.42 | 5.78 |
| PAT (₹ Cr) | 0.04 | 1.13 | 2.24 | 3.32 | 4.34 |
| Cash Accrual (₹ Cr) | 1.14 | 2.23 | 3.34 | 4.37 | 5.34 |
| Term Loan Repayment (₹ Cr) | 0.00 | 1.83 | 1.83 | 1.83 | 1.83 |
| DSCR | – | 0.79 | 1.29 | 1.78 | 2.37 |
Moratorium in Year 1. DSCR improves as utilisation stabilises and loan principal reduces. Average DSCR across repayment years trends above 1.5 in this illustration.
The table demonstrates how improved utilisation and product mix strengthening can gradually improve DSCR and ROI, provided working capital is adequately funded and operating expenses are controlled.
Product-Wise Financial Projection Considerations
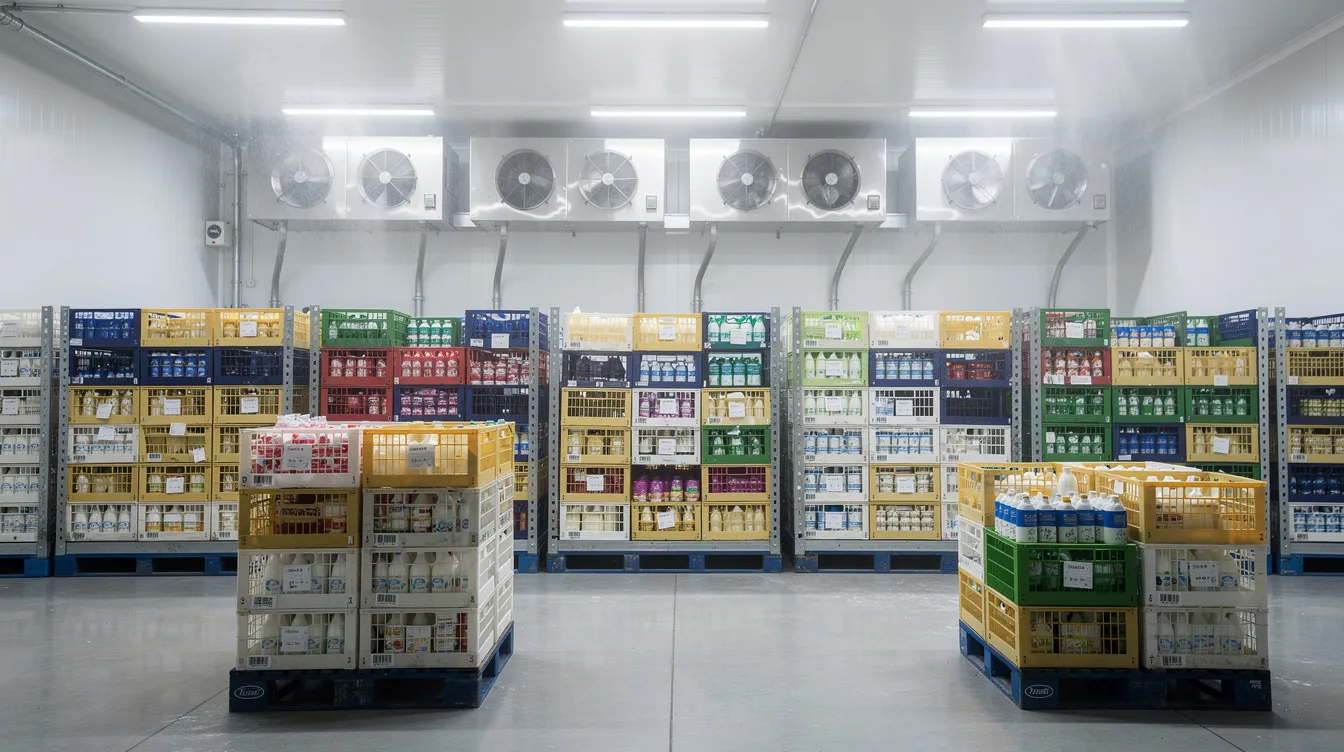
Within a single dairy plant financial model, different value-added products have very different yield, cost, and pricing patterns and should be modelled separately at the assumption level. Product mix optimization is necessary because the contribution margin of paneer differs vastly from that of lassi or probiotic drinks. Consistent linkage between product-wise assumptions and the consolidated plant P&L, cash flow, and DSCR schedules is essential.
Paneer
Typical milk-to-paneer yield assumptions range from 6-7 litres of milk per kg of paneer, though fat content and coagulation efficiency affect this ratio. Capital needs include paneer presses, chilling vats, cutting equipment, and vacuum packaging machines. Institutional sales (bulk blocks to restaurants and caterers) carry lower realisations but stable volumes, while retail consumer packs offer higher margins with greater packaging and distribution costs. Shelf life of fresh paneer is limited (7-15 days under refrigeration), driving tight inventory turnover assumptions. For a dedicated paneer project, refer to the Industrial Paneer Manufacturing Plant Project Report.
Curd / Dahi
Fermentation-based yield assumptions and control over process losses during setting are critical. Curd/dahi is a high-volume, lower-per-unit-margin product with strong price sensitivity in many Indian markets. Packaging options (pouches vs cups vs tubs) create different cost and logistics structures. Limited shelf life drives higher stock-turn assumptions and lower finished-goods holding days in working-capital calculations. For more details, see the Curd / Dahi Manufacturing Plant Project Report.
Industrial Yogurt
Yogurt production requires controlled culture usage, incubation, and cooling, impacting power, culture cost, and labour in the financial projections. Flavoured yogurt has higher ingredient and packaging costs but can command premium pricing in urban markets and modern retail. Channel mix (modern trade, HoReCa, institutional co-packing) affects discounts and trade margins. The Industrial Yogurt Manufacturing Plant Project Report provides product-specific modelling guidance.
Greek Yogurt
Greek yogurt requires higher milk solids through straining or concentration, leading to lower yield (more litres of milk per kg of finished product) but significantly higher MRP. This high milk-intensity makes Greek yogurt particularly sensitive to milk price increases. Premium packaging (cups with lids, sleeves, sometimes added toppings) raises packaging cost per unit compared with regular yogurt. Refer to the Greek Yogurt Manufacturing Plant Project Report for dedicated financial modelling.
Lassi
Key assumptions for lassi include standardised fat/SNF content, sugar and flavour usage, and packaging format (bottles, cups, pouches). Lassi demand is strongly seasonal with summer peaks, causing significant monthly revenue swings that must be reflected in cash-flow planning. Distribution spans general trade, modern retail, quick-service restaurants, and institutional catering. The Industrial Lassi Manufacturing Plant Project Report covers these projection nuances.
Probiotic Dairy Products
Probiotic dairy products involve specialised cultures, stricter process controls, and more careful cold-chain handling, raising both capex and opex. Marketing and branding costs are higher because probiotics target niche, health-conscious consumer segments that require sustained brand-building investment. Volume projections should be conservative until brand acceptance is established. For single-product DPR guidance, see the Probiotic Dairy Products Manufacturing Plant Project Report.
Common Mistakes in Value-Added Dairy Plant Financial Projections
Many dairy DPRs are rejected or delayed because of avoidable mistakes in assumptions, structure, and internal consistency. Assuming 90-100% capacity utilisation from Year 1 is perhaps the most common error, followed closely by using unrealistic selling prices far above local market benchmarks and ignoring seasonal milk-price fluctuations that can swing procurement cost by ₹3-5 per litre between flush and lean seasons.
Ignoring product returns and wastage, or assuming zero stock losses, leads to overstated profitability in dairy plant sales and revenue projections. Underestimating packaging and cold-chain costs is equally damaging, particularly for short-shelf-life products where spoilage directly erodes margins.
Structural mistakes include missing margin money for working capital in project cost, ignoring interest during construction, not linking depreciation to actual capital expenditure, and designing unrealistic term-loan repayment schedules that crush DSCR in early years. Consistent DSCR calculation, correct mapping of subsidy benefits, and transparent written assumptions help avoid queries from credit officers. A bank ready project report must withstand scrutiny on every line.
Financial Projections Required by Banks in a Dairy Plant DPR
Formats may vary across SBI, PNB, private sector banks, and cooperative banks, but content expectations are broadly similar. Banks typically require 5-7 year projected profit and loss account, projected balance sheet, projected cash flow statement, fund flow statement where asked, working-capital assessment, term-loan amortisation schedule, interest and depreciation schedule.
Additionally, banks expect DSCR analysis, break-even calculation, financial ratios, ROI and IRR analysis, and sensitivity scenarios. The distinction between a comprehensive DPR and CMA Data is important: a DPR is project-specific with technical and market sections, while CMA focuses on standardised bank-format financial statements. All annexures in the dairy plant bank loan project report must be internally consistent to avoid credit committee objections.
How Financial Projections Support Bank Loan Appraisal and Decision Making
From the perspective of a practising Chartered Accountant, credit officers and project-finance teams interpret dairy plant projections to assess whether the promoter contribution is adequate, whether project cost is reasonable, and whether revenue assumptions are defensible. Lenders evaluate realistic revenue growth rather than exponential jumps, reasonable gross margins compared to industry benchmarks, and prudent assumptions on capacity ramp-up.
Strong DSCR, sustainable cash accrual, and clear visibility of repayment from business cash flows significantly improve loan-approval prospects. A transparent, well-structured financial model gives confidence to lenders that the promoter understands dairy plant operations and farm management, not just spreadsheet numbers. India being the world’s largest milk producer creates both opportunity and competitive pressure, making conservative projections even more important.
Financial Projections vs Actual Performance: Managing Variance
All financial projections for value-added dairy plant DPRs are estimates based on assumptions. Actual performance will inevitably differ due to raw milk price movements, shifts in consumer demand, delays in capacity ramp-up, plant downtime, regulatory changes, and interest-rate movements.
Promoters should use the original dairy plant financial model as a live tool, updating it annually with actual numbers to compare against projections and adjust strategy on product mix, pricing, and cost control. Early detection of negative trends (falling DSCR, stretched working capital, declining contribution) allows corrective steps before the situation affects loan servicing. Projections are decision-support tools for both banks and promoters, not performance guarantees. Monitoring operational efficiency and comparing it against projected benchmarks is essential for sustained dairy profitability.
Role of a Chartered Accountant in Dairy Project Financial Modelling
In my practice as CA Manish Gugliya, I have worked extensively on project finance, MSME advisory, CMA data preparation, and dairy plant DPR development. A Chartered Accountant assists promoters in structuring project cost, designing means of finance, developing realistic operating assumptions on capacity, product mix, pricing, and yields, and building integrated financial statements.
Professional support includes preparation and analysis of the projected profit and loss account, projected balance sheet, projected cash flow, working-capital assessment, term-loan repayment schedules, DSCR, break-even, ROI, and IRR calculations, and sensitivity scenarios. I prepare, evaluate, analyse, and review financial projections and help present them in a bank-oriented format. However, I do not guarantee loan sanction or business profitability. No professional can or should make such claims.
Well-prepared value-added dairy plant financial projections help promoters make informed choices on scale, product mix, and financing before committing substantial capital. They provide valuable insights into which products contribute most to margins, where risks lie, and what repayment capacity the dairy farm business or processing plant can realistically sustain.
Frequently Asked Questions
How many years of financial projections should a value-added dairy plant DPR contain?
Most Indian banks expect at least 5-year projections for medium and large dairy processing units. Where term loans extend to 7-10 years, a longer DSCR view may be required. The first 3 years are critical for capacity ramp-up analysis, while later years demonstrate stabilised margins and long-term debt-servicing capacity. Project-IRR and net present value calculations often consider the full economic life of major assets (10-12 years) even if detailed financial statements in the DPR stop at Year 5-7.
What capacity utilisation is realistic to assume in Year 1 for a new value-added dairy plant?
For a greenfield value-added dairy plant in India, Year 1 capacity utilisation is often kept around 50-60%, assuming proper pre-launch marketing and distribution planning. Banks become cautious if Year 1 utilisation is shown above 70-75% unless there is a strong tie-up with existing brands or assured institutional orders. A gradual ramp-up (55-60% in Year 1, 65-75% in Year 2, 75-85% in Year 3) supported by a marketing strategy appears more credible during bank appraisal.
How is milk procurement cost treated in the dairy plant financial model?
Milk procurement cost is projected per litre, with separate assumptions for cow and buffalo milk if both are used. Transport, chilling, and quality-testing charges are included where applicable. Projections should model seasonal price variation between flush and lean seasons and possible annual escalation rather than assuming a flat rate. Running sensitivity analysis on milk prices (e.g., +₹1-2 per litre) helps assess the impact on EBITDA and DSCR, since milk is the single largest cost in value-added dairy processing.
Should paneer, yogurt, lassi and other products be projected separately or combined?
For bank-ready dairy processing plant financial projections, it is best practice to project each major product segment separately at the assumption level. Separate product-wise assumptions on milk yield per finished product, selling price, packaging cost, and margins identify which SKUs contribute most to overall profitability. In the consolidated P&L, numbers are aggregated, but a product-wise working sheet greatly improves accuracy and credibility during discussions with lenders and farmer producer organisations considering investment.
Can the same financial projections be used for both term loan and working capital sanction?
The same base financial model should drive both term-loan and working-capital assessment, but banks may use different appraisal methods (projected balance sheet method, turnover method, or Kisan Credit Card norms for smaller operations) for working capital. While revenue and cost assumptions stay common, working-capital projections require additional detail on inventory holding, receivable days, and creditor days. Preparing a single integrated model and extracting term-loan schedules and working-capital assessment from it maintains consistency, avoids repayment period mismatches, and reduces confusion during credit appraisal. The loan amount for working capital should reflect peak-season requirements of milk and dairy products.
Conclusion
Sound value-added dairy plant financial projections for DPR connect technical design, capacity planning, product mix, procurement strategy, pricing, cost control, and financing structure into one coherent model. A robust dairy plant financial model integrates installed capacity, realistic capacity utilisation, product-wise revenue, detailed cost of production, working capital, term-loan repayments, DSCR, break-even, ROI, and IRR into a bank-oriented format that withstands appraisal scrutiny. Capital costs, operating costs, and the repayment capacity of the project must all be visible in the financial analysis.
Projections should remain realistic and conservative, with clear written assumptions and sensitivity checks rather than optimistic top-line and net profit margin numbers that do not stand up to bank scrutiny. The dairy sector in India offers substantial opportunity, but success depends on disciplined planning, not just enthusiasm. The financial implications of every assumption ripple through every statement in the DPR.
As CA Manish Gugliya, I have seen that carefully prepared, assumption-driven projections not only support bank loan applications through subsidized loans and commercial dairy farm loans but also help promoters take informed business decisions about scale, product selection, and risk management. A well-built financial model is not just a document for lenders; it is a strategic tool for the promoter in the dairy farming sector.
CA Manish Gugliya Project Report & Financial Advisory www.projectreportbank.com