
Profitability in poha manufacturing is never as straightforward as subtracting paddy cost from poha selling price. The actual financial outcome of a poha plant depends on recovery percentages, capacity utilisation, product mix, operating efficiency, financing structure and market realisation – all working together. This practical guide, written from the perspective of CA Manish Gugliya, FCA, DISA (ICAI), breaks down every layer of poha manufacturing profitability and equips entrepreneurs, bankers and project-finance professionals with the analytical framework they need to evaluate a poha project correctly.
Key Takeaways
Poha manufacturing profitability depends on multiple operational and financial factors working in tandem – not simply on the price gap between raw paddy and finished rice flakes. India’s poha market size exceeds ₹8,500 crore annually, and the sector offers real business opportunities for well-planned units. However, profitability is never automatic.
- In typical well-run poha manufacturing units, net profit margins may range roughly from single-digit percentages (loose/wholesale) to the low-twenties (branded retail), depending on capacity utilisation, product mix and disciplined cost control. These are illustrative ranges, not promised returns.
- Break-even capacity for many viable poha plants generally lies around 45–60% of installed capacity in bankable projects, governed by contribution margin and fixed-cost structure.
- A proper poha manufacturing DPR must always cover revenue model, production cost and profit, break-even analysis, cash-flow projections, debt service coverage ratio and sensitivity analysis before promoters commit capital.
- This article is written in the professional, advisory voice of CA Manish Gugliya for www.projectreportbank.com, aimed at entrepreneurs, bankers and project-finance professionals evaluating poha manufacturing business profit in India.
- Profit margins in poha manufacturing typically range from 20% to 30% at gross level, but net margins after interest, depreciation and tax are considerably lower and depend entirely on the individual unit’s operations and financing.
Understanding Poha Manufacturing Profitability – A Chartered Accountant’s View
A common mistake I see among first-time promoters is treating poha manufacturing profitability as a simple arithmetic exercise: buy paddy at ₹20–24/kg, sell poha at ₹30–38/kg, and assume the difference is profit. In practice, this comparison is dangerously misleading.
Actual poha manufacturing business profit depends on raw material recovery (how many kilograms of finished flattened rice you extract per 100 kg of raw paddy), by-product income from bran, husk and broken flakes, your plant’s capacity utilisation through the year, manufacturing process efficiency, and the full spectrum of fixed and variable costs including interest and depreciation charges.
A bankable detailed project report evaluates projected revenue, cost of production, contribution, EBITDA, profit before tax, profit after tax, break-even point, DSCR, ROI and cash accruals – typically over a horizon of at least 5–7 years. Without this structured financial analysis, neither the promoter nor the lender can meaningfully assess whether the poha project is viable.
As a practising Chartered Accountant, I structure poha manufacturing project profitability analysis by first establishing realistic production capacity, then working through recovery assumptions, building a full revenue model, layering in variable and fixed costs, computing contribution and break-even, projecting profit and loss year-wise, and finally testing the numbers under sensitivity and scenario analysis. This chain – Capacity → Production → Recovery → Sales → Variable Cost → Contribution → Fixed Cost → EBITDA → Interest → Depreciation → Profit → Cash Accrual → Debt Servicing – is the backbone of every credible Poha plant operating cost and cost of production analysis.
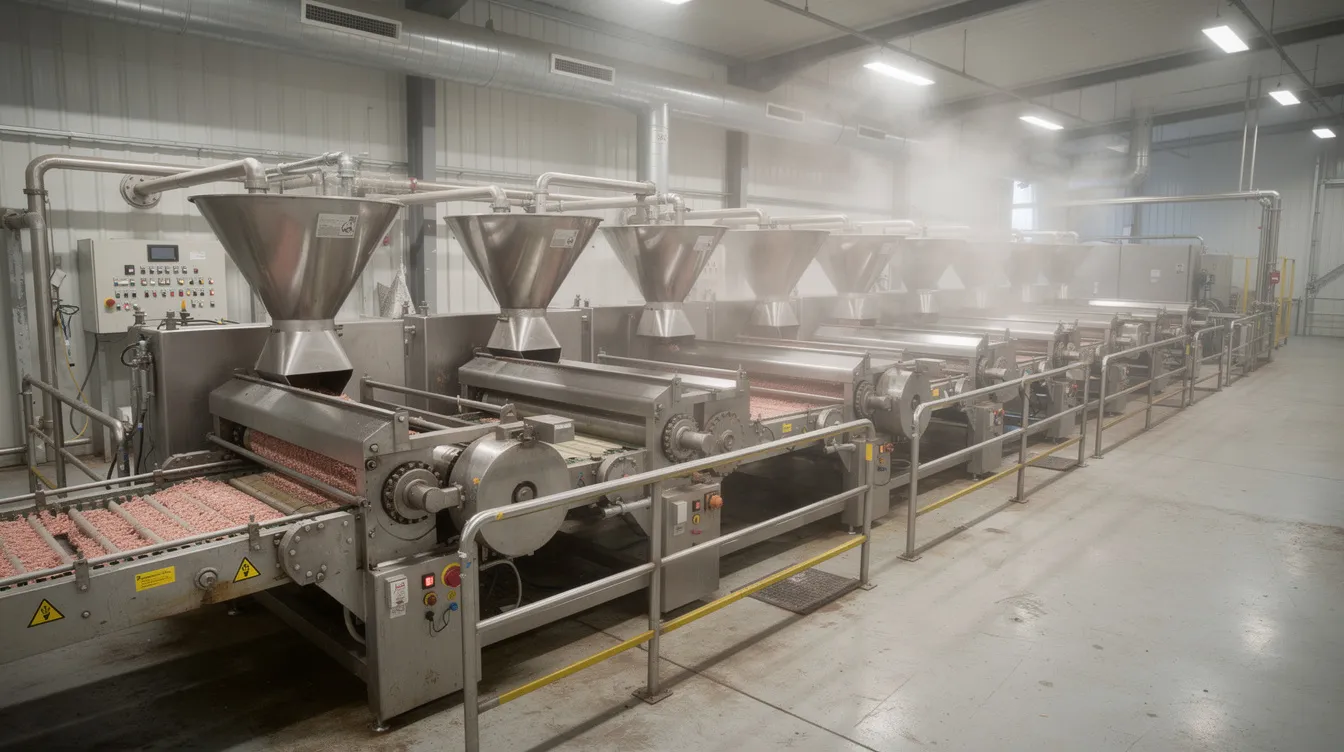
Is Poha Manufacturing Business Profitable in India?
Yes – poha manufacturing can be profitable in India when the plant is planned correctly, operates at adequate capacity utilisation and manages paddy procurement and costs efficiently. Poha consumption is consistent year-round with no significant seasonal dips, which provides a stable demand foundation that many food processing industry segments lack.
Conditions that support sustainable poha plant profit margin include:
- Realistic plant sizing matched to local and regional market demand
- Efficient paddy procurement, ideally timed during peak harvest seasons to lower input costs
- Controlled process losses and consistent Poha recovery above 70%
- Good product quality and hygiene, supported by mandatory registrations – FSSAI registration is mandatory for food manufacturing units, Udyam registration is required for MSME classification, GST registration is necessary for turnover above ₹40 lakh, trade licence is required from local authorities for manufacturing, and Pollution Control Board approval is needed based on local regulations
- Strong distribution and direct-to-retail strategies that can improve margins by eliminating middle-tier brokers
- Adequate working capital and prudent borrowing
Poha manufacturing project profitability may weaken when market realisation drops due to local competition, when paddy prices spike beyond budget, when capacity remains underutilised below break-even, when debt burden is excessive, or when quality issues lead to discounts or rejections.
To give a practical sense of margin variation (illustrative only):
| Sales Channel | Indicative Net Margin |
|---|---|
| Loose / wholesale poha | 8–11% |
| Branded retail packaged poha | 16–22% |
| Institutional supply | 12–16% |
| Export-grade / premium packaged | 24–32% |
Every poha manufacturing business plan in India must be backed by a unit-specific feasibility study and detailed project report rather than relying on generic profitability numbers published online.
Revenue Model of a Commercial Poha Plant
Poha manufacturing project profitability must be assessed on total revenue from all outputs derived from the paddy input – not merely the selling price of the primary finished product.
A commercial poha plant typically produces several product variants: thick poha, medium poha, thin poha, premium packaged poha (branded), flavoured or fortified variants, and institutional or bulk beaten rice supplied to hotels, caterers and mid-day meal programmes. Urban consumers increasingly prefer branded poha over loose commodity sales, and branded packaged poha margins range from 18% to 25%. Poha is also exported to the Indian diaspora in markets abroad, commanding a 30–40% premium over domestic prices.
By-product revenue streams – bran, husk, broken flakes and other usable material – can add 2–6% additional revenue depending on local market conditions. Selling byproducts like rice husk and broken rice adds secondary revenue streams that many project reports overlook.
Flaked poha is ideally packed within 24 hours to prevent moisture absorption, and moisture-barrier packaging extends shelf life and reduces spoilage – both factors that support better realisation in retail channels. Branded packaging yields higher profit margins than bulk unbranded sales.
Illustrative Product-Mix Table (sample only – actual figures vary by plant and market)
| Output | Approx. % of Paddy Input | Indicative Selling Price (₹/kg) |
|---|---|---|
| Standard / medium poha | 55–60% | 28–35 |
| Thin / premium poha | 10–15% | 32–40 |
| Bran | 7–9% | 18–22 |
| Husk | 10–13% | 2–4 |
| Broken flakes | 3–5% | 15–20 |
Market selling prices range between ₹25–40 per kg depending on grade, packaging and region. A comprehensive understanding of Poha plant revenue model and product realization is essential before building financial projections.
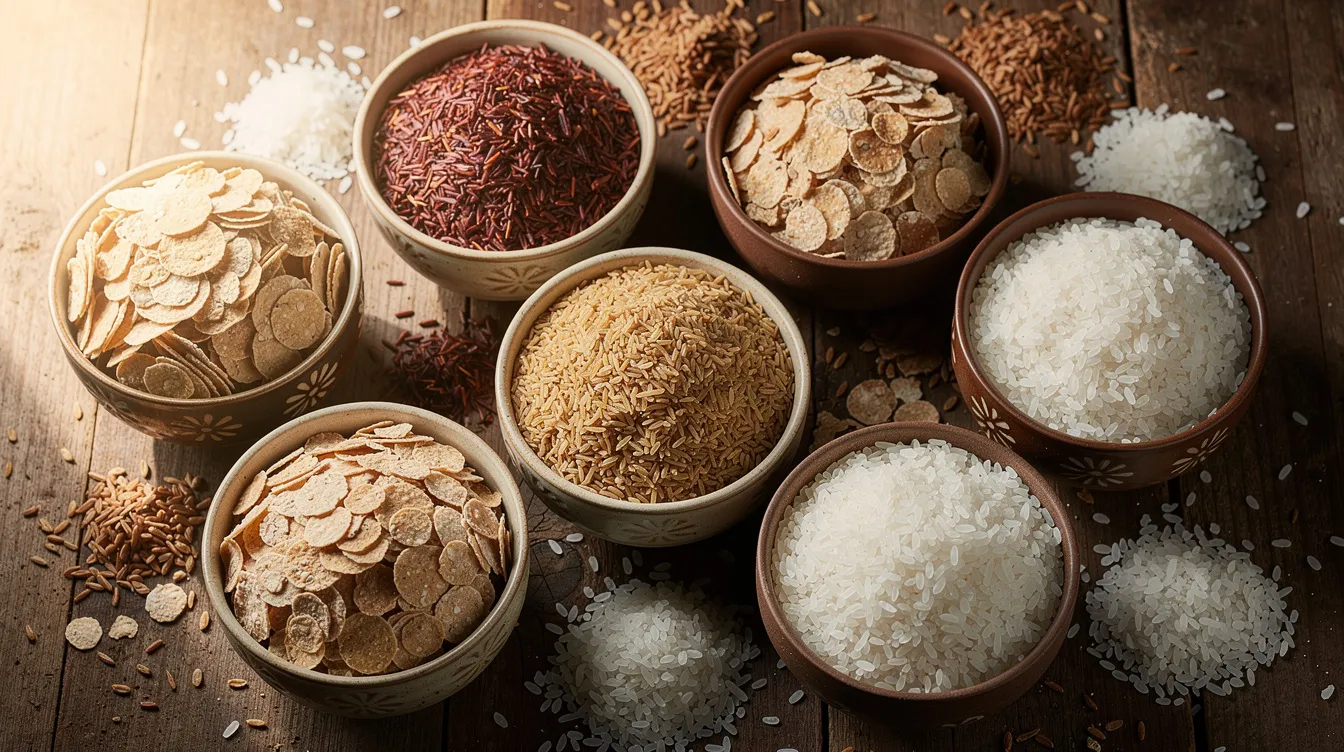
Cost Structure of Poha Manufacturing – Fixed vs Variable
Before discussing break-even point or profitability ratios, it is essential to correctly understand the poha plant fixed and variable cost structure.
Variable Costs
Variable costs move roughly in proportion to production volume. Key items include:
- Raw paddy (the single largest cost, typically 55–65% of total cost)
- Fuel expenses for roasting and drying
- Electricity linked to production (machinery, rollers, elevators)
- Packing material cost (bags, pouches, cartons, labels)
- Production labour and incentive-based wages
- Consumables (lubricants, spare parts)
- Freight outwards and handling charges
- Charges selling – trade discounts and sales commission
Fixed Costs
Fixed costs remain largely stable irrespective of small changes in output:
- Supervisory and management salaries
- Administration expenses
- Factory overhead (security, housekeeping, canteen)
- Rent or lease of premises
- Insurance premiums
- Routine repairs and maintenance
- Minimum power demand charges
- Professional charges (audit, legal, compliance)
Illustrative Cost Classification
| Cost Item | Nature |
|---|---|
| Raw paddy purchase | Variable |
| Fuel for roasting | Variable |
| Production electricity | Variable |
| Packaging material | Variable |
| Direct production labour | Variable / Semi-variable |
| Freight outward | Variable |
| Factory rent / depreciation | Fixed |
| Supervisory salaries | Fixed |
| Insurance | Fixed |
| Admin & office expenses | Fixed |
| Repairs & maintenance | Fixed |
Contribution margin and break-even analysis rely on correctly classifying costs as fixed or variable. For a deeper breakdown of each line item, refer to the detailed Poha production cost analysis published separately.
Raw Material Economics – Paddy Procurement & Its Impact on Margins
In most poha plants, paddy constitutes the largest share of operating expenses – typically 55–65% of the cost of production. This single variable drives overall poha production cost and profit more than any other factor.
Paddy purchase price for poha-grade varieties typically ranges from ₹19–26/kg depending on season, region, moisture content and grain quality. For reference, the MSP for common paddy for KMS 2025-26 was approximately ₹2,369 per quintal. Procuring raw materials during peak harvest seasons helps lower input costs, while off-season buying without hedging can erode poha plant operating profit substantially.
The choice of variety (IR-64, Sona Masuri, etc.), moisture levels, grain size and pre-parboiling quality directly affect poha recovery percentage and the selling realisation of finished flakes. Procurement models – direct from farmers, through mandis, via rice mills or aggregators – each carry different logistics, bagging, storage losses and credit terms that influence overall poha manufacturing cost analysis.
For detailed guidance on procurement planning, see paddy procurement and raw material planning for poha plant.
Manufacturing Recovery, Yield & Material Balance
Material balance in poha production refers to how the input paddy splits into finished poha, by-products and losses through the manufacturing process. Approximately 70–75 kg of poha is produced from 100 kg of raw paddy – this is the recovery range observed across well-run plants, though it varies by paddy quality, machinery and process control.
Illustrative Material Balance (per 1,000 kg paddy – sample only)
| Output | Quantity (kg) |
|---|---|
| Poha flakes (main product) | 700–740 |
| Bran | 70–90 |
| Husk | 100–130 |
| Broken flakes | 30–50 |
| Moisture loss & process waste | 30–50 |
During the process, paddy is soaked for 3–4 hours before roasting. Roasting occurs at temperatures between 180°C and 220°C, and flaking rollers produce poha flakes of varying thickness. Quality control measures must ensure moisture levels remain below 13% in the finished product for acceptable shelf life.
Even a 1–2% improvement in poha recovery can significantly increase poha manufacturing EBITDA margin at the same raw material cost. Key technical factors affecting recovery include soaking time, roasting temperature, roller settings, operator skill, moisture control and consistent paddy quality. Using automation in processing can reduce labor costs and ensure product consistency across batches.
For a step-wise understanding of the poha manufacturing process and process flow chart, refer to our detailed technical article.
Capacity Utilisation and Its Direct Effect on Poha Plant Profitability
Most poha manufacturing plant profitability models assume a ramp-up from lower utilisation in Year 1 (typically 50–60%) to higher utilisation (80–90%) over 2–3 years as distribution networks, market acceptance and order commitments build up.
Fixed costs get spread over higher production volumes at higher utilisation, improving per-kg cost and operating profit. A 500 kg/day unit produces approximately 13 tonnes monthly at full operation – but if it runs at only 50% utilisation, the same fixed overheads are absorbed by roughly half the output.
Illustrative Profitability at Different Capacity Utilisation (notional plant – all figures illustrative only)
| Parameter | 50% Util | 70% Util | 90% Util |
|---|---|---|---|
| Annual production (MT) | 120 | 168 | 216 |
| Revenue (₹ lakh) | 38.4 | 53.8 | 69.1 |
| Variable cost (₹ lakh) | 27.6 | 38.6 | 49.7 |
| Contribution (₹ lakh) | 10.8 | 15.2 | 19.4 |
| Fixed cost (₹ lakh) | 9.5 | 9.5 | 9.5 |
| EBITDA (₹ lakh) | 1.3 | 5.7 | 9.9 |
| Interest + Depreciation (₹ lakh) | 3.8 | 3.8 | 3.8 |
| PBT (₹ lakh) | (2.5) | 1.9 | 6.1 |
At 50% utilisation, this illustrative plant is loss-making. At 70%, it turns modestly profitable. At 90%, profit before tax improves substantially. This is why banks examining a poha plant project report expect realistic utilisation assumptions rather than 100% from the first year.
For guidance on selecting the right installed capacity, see poha plant capacity planning and production capacity.
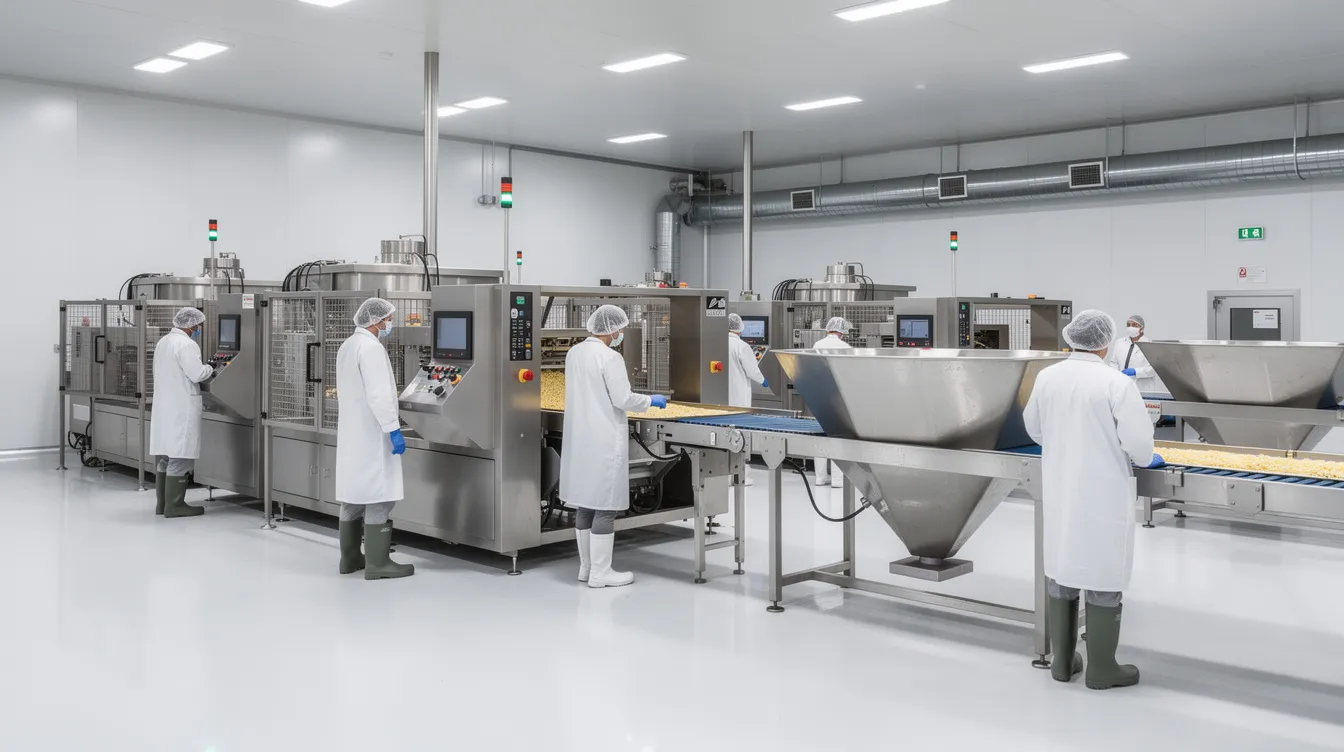
Contribution Margin in Poha Manufacturing
Contribution is defined as Sales Revenue minus Variable Costs, and it is one of the core profitability drivers in any poha manufacturing financial projections. The contribution margin percentage (Contribution ÷ Sales Revenue × 100) tells you what portion of each rupee of sales is available to cover fixed costs and generate profit.
Gross contribution varies from ₹5–15 per kg depending on paddy cost, selling price and efficiency. Here is an illustrative example:
| Item | ₹ per kg |
|---|---|
| Selling price (weighted average) | 34.00 |
| Variable cost per kg | 27.00 |
| Contribution per kg | 7.00 |
| Contribution margin % | 20.6% |
(All values illustrative only)
A higher contribution margin allows a poha plant to cover fixed costs faster, achieve a lower break-even point and generate better EBITDA and net profit at any given utilisation level.
Break-Even Analysis for a Poha Manufacturing Unit
The poha plant break-even point is the level of sales at which total contribution equals total fixed costs – there is neither profit nor loss. It is the single most important financial threshold for both promoters and lenders.
Formulas:
- Break-Even Sales (₹) = Fixed Costs ÷ Contribution Margin Ratio
- Break-Even Quantity (kg) = Fixed Costs ÷ Contribution per kg
Illustrative Example (sample only):
Assume annual fixed costs of ₹18 lakh, contribution per kg of ₹7 and average selling price of ₹34/kg.
- Break-even quantity = ₹18,00,000 ÷ ₹7 = 2,57,143 kg (~257 MT)
- Break-even sales = 2,57,143 × ₹34 = ₹87.4 lakh
If installed annual capacity is 480 MT, break-even capacity utilisation = 257 ÷ 480 = 53.5%.
Break-even is typically reached at 48–55% of capacity in many bankable poha projects, consistent with published project profiles from NIIR project consultancy services which report BEP at approximately 45% for a 10 tonnes/day plant. For bankers and CAs, the break-even calculation is used alongside DSCR and ROI to judge project feasibility and risk.
Break-Even Capacity Utilisation – How Much Loading Is “Safe”?
Break-even capacity utilisation is the minimum percentage of installed capacity that must be utilised to cover all fixed operating costs. A lower break-even capacity (say 40–50%) is safer from a lender’s perspective than a high one (say 70–80%), especially in a competitive or cyclical market.
High fixed costs – expensive building, oversized machinery, heavy management salaries – or low contribution margins push break-even utilisation dangerously upward.
Illustrative Comparison of Two Hypothetical Poha Plants
| Parameter | Plant A (Conservative) | Plant B (High Fixed Cost) |
|---|---|---|
| Annual fixed cost (₹ lakh) | 12.0 | 22.0 |
| Contribution per kg (₹) | 8.0 | 6.5 |
| Break-even quantity (MT) | 150 | 338 |
| Installed capacity (MT/yr) | 360 | 480 |
| Break-even utilisation (%) | 41.7% | 70.5% |
Plant A is far more resilient to demand or price shocks. Promoters should test their poha manufacturing business financial feasibility under slightly lower than expected utilisation to ensure the project remains viable for bank finance.
Profit Per Kg of Poha – Interpreting the Numbers Correctly
Many entrepreneurs ask “What is the profit per kg in poha manufacturing?” The honest answer is: it depends entirely on cost structure, utilisation, interest, depreciation and tax position.
- Contribution per kg: ₹5–15 (illustrative, before fixed costs)
- EBITDA per kg: lower, after deducting allocated fixed operating costs
- Net profit per kg: further reduced by interest, depreciation and tax
For example, if annual EBITDA is ₹6 lakh on 168 MT production, EBITDA per kg is approximately ₹3.57. After interest and depreciation, net profit per kg could be ₹1–2 or even negative at low utilisation.
Relying on informal market claims like “₹5 per kg guaranteed profit” without reviewing a proper poha plant revenue cost and profit analysis in a structured project report is risky. For bank loan discussions, it is far more meaningful to discuss annual EBITDA margin, net profit margin and DSCR than “profit per kg” in isolation.
Gross Profit, EBITDA and Net Profit – Understanding the Layers
The typical structure of a poha manufacturing profit and loss statement flows as:
Revenue → Cost of Goods Sold → Gross Profit → Operating Expenses → EBITDA → Depreciation & Interest → Profit Before Tax → Tax → Profit After Tax
Key Margin Definitions:
- Gross margin = Gross Profit ÷ Revenue × 100
- EBITDA margin = EBITDA ÷ Revenue × 100
- Net profit margin = PAT ÷ Revenue × 100
Illustrative P&L Snapshot (one sample year – notional figures only)
| Line Item | ₹ Lakh |
|---|---|
| Revenue | 55.0 |
| Variable costs | 39.6 |
| Contribution | 15.4 |
| Fixed operating cost | 9.5 |
| EBITDA | 5.9 |
| Interest | 2.1 |
| Depreciation | 1.7 |
| PBT | 2.1 |
| Tax (25%) | 0.5 |
| PAT (Net Profit) | 1.6 |
EBITDA margin here is approximately 10.7% and net profit margin about 2.9%. Banks and financial institutions focus heavily on EBITDA, DSCR and cash accruals, while also checking net margins for long-term sustainability.
EBITDA Margin and Net Profit Margin in Poha Plants
A “healthy” poha manufacturing EBITDA margin in reasonably efficient projects may conceptually fall in the mid-teens to low-twenties percentage range – but this is indicative and depends on utilisation, product mix, raw material cost and energy costs. Net margin for branded retail poha is typically 16–22%, while export-grade poha can achieve a net margin of 24–32%.
Two plants with similar EBITDA margin might show very different net profit margins because of different interest burdens, depreciation levels and tax positions.
Illustrative Comparison – Same Operating Results, Different Financing
| Parameter | Low-Debt Plant | High-Debt Plant |
|---|---|---|
| Revenue (₹ lakh) | 55.0 | 55.0 |
| EBITDA (₹ lakh) | 5.9 | 5.9 |
| EBITDA margin | 10.7% | 10.7% |
| Interest (₹ lakh) | 0.8 | 3.2 |
| Depreciation (₹ lakh) | 1.5 | 1.5 |
| PBT (₹ lakh) | 3.6 | 1.2 |
| Net margin (approx.) | 4.9% | 1.6% |
For equity investors, poha manufacturing ROI also depends on total project cost, share capital, promoter contribution and the debt equity ratio, not only annual net margin.
Role of Project Cost, Machinery and Layout in Profitability
Over-investing in land, civil construction or oversized machinery can depress poha manufacturing ROI and inflate yearly depreciation and interest obligations. The total project cost for a commercial poha manufacturing plant includes land, site development, building and civil works, plant and machinery, electrical installations, utilities, preliminary and pre-operative expenses (including fixtures pre operative costs), contingency and margin for working capital.
For a 500 kg/day poha setup, the indicative equipment required and costs include:
| Equipment | Indicative Cost (₹) |
|---|---|
| De-stoner and aspirator | 30,000–60,000 |
| Soaking tanks | 25,000–50,000 |
| Rotary roasting drum | 1–2 lakh |
| Flaking mill with rollers | 2–4 lakh |
| Automatic packing machines | 1.5–4 lakh |
A 500 kg/day poha setup typically costs ₹5–10 lakh for machinery alone, with total project cost higher after land, building and working capital. High-capacity continuous plants achieve a lower cost per kilogram than small batch setups due to economies of scale.
Choosing appropriate capacity and right level of automation supports contribution margin and break-even profile. See detailed benchmarks in our poha plant machinery and equipment cost guide and the poha plant project cost and means of finance reference. An efficient plant layout reduces material handling, labour movement and energy consumption, directly supporting margins.
Utilities, Manpower and Their Influence on Operating Margins
Power, fuel and manpower are major operating cost drivers, especially in medium and large-scale poha manufacturing units. Energy and fuel efficiency significantly impact operational costs in poha manufacturing – roasting ovens, drying systems and rollers are inherently energy-intensive.
Typical utility requirements include electrical connected load for machinery (crushers, rollers, elevators, lighting), fuel (rice husk, biomass, LPG or natural gas) for roasting and drying using hot water or steam systems, and water for soaking and cleaning. Energy costs can vary significantly by state tariff, fuel availability and whether backup power is required.
Manpower ranges from skilled operators and helpers to boiler/roaster attendants, quality supervisors, maintenance staff and admin/sales support. Supervisory and management salaries are largely fixed, while production labour may be partly variable.
Improving energy efficiency – better insulation, efficient burners, proper preventive maintenance – and optimising manpower deployment can meaningfully improve EBITDA margin. For detailed requirements, see the poha plant utilities, power, fuel and manpower requirements guide.
Sensitivity Analysis – How Profits Change When Assumptions Change
Sensitivity analysis in a poha manufacturing DPR tests how business profit reacts to changes in key variables. This is not optional – it is essential for any serious market study or feasibility study.
A 5% increase in paddy cost, where raw material is about 60% of total cost, can compress contribution margin by 3–4 percentage points and push break-even utilisation higher. A 5% decrease in average selling price similarly erodes contribution per kg, requiring higher volumes to maintain the same EBITDA. Lower capacity utilisation – say 60% instead of 80% – causes EBITDA to decline sharply because fixed expenses remain unchanged. Conversely, a 1–2% improvement in poha recovery improves revenue from the same raw material input without significant incremental cost.
Illustrative Sensitivity Table (base vs variations – sample only)
| Scenario | Revenue (₹ lakh) | Contribution (₹ lakh) | EBITDA (₹ lakh) |
|---|---|---|---|
| Base case (75% util, current prices) | 53.8 | 15.2 | 5.7 |
| +5% paddy cost | 53.8 | 13.3 | 3.8 |
| –5% selling price | 51.1 | 12.5 | 3.0 |
| 60% utilisation | 43.0 | 12.2 | 2.7 |
| +2% recovery improvement | 55.5 | 16.9 | 7.4 |
Banks routinely look for such downside-scenario working in a poha plant project report to ensure the project remains serviceable even under moderate stress. Promoters should run this analysis before finalising investment opportunities or applying for term loans.
Scenario Analysis – Conservative, Base and Optimistic Cases
A structured poha manufacturing financial feasibility study generally models three scenarios: Conservative, Base Case and Optimistic. This is standard practice in project reports prepared for bank finance.
Illustrative Three-Scenario Comparison (all figures notional and for illustration only)
| Parameter | Conservative | Base Case | Optimistic |
|---|---|---|---|
| Capacity utilisation | 55% | 75% | 90% |
| Avg. selling price (₹/kg) | 30 | 34 | 37 |
| Annual revenue (₹ lakh) | 35.6 | 53.8 | 71.9 |
| EBITDA (₹ lakh) | 1.8 | 5.7 | 12.3 |
| EBITDA margin | 5.1% | 10.6% | 17.1% |
| Net profit (₹ lakh) | (1.2) | 1.6 | 7.2 |
| Net margin | – | 3.0% | 10.0% |
| Break-even capacity | 53% | 53% | 53% |
Lenders use these scenarios to understand profitability stability and assess DSCR under different conditions. Promoters should avoid basing decisions solely on the optimistic scenario and should plan debt repayment according to conservative projections. The projected pay back period under the base case is typically 4–6 years for well-managed units.
Working Capital, Debt Structure and Cash-Flow Impact
The poha manufacturing business requires substantial working capital for seasonal paddy procurement, storage, the processing cycle, finished goods inventory and credit to distributors or institutional buyers.
Even a profitable poha plant can face cash stress if receivables collection is slow or inventories are bloated. Accounting profitability and cash flow are different – a positive net profit on the balance sheet does not guarantee money in the bank.
Term loans and working capital borrowing impact interest cost, DSCR and net profitability. The role of promoter margin money (typically 25–30% of project cost), loan tenure and moratorium period shape the repayment burden. Over-leveraging – a poor debt equity ratio – can make net profit margin and DSCR weak despite acceptable operating margins. Project profitability (return on total assets) and equity profitability (return on promoter’s funds) are distinct concepts.
Banks review projected DSCR, interest coverage ratio and cash accruals alongside profitability when assessing viability. In published models, Year-1 DSCR of approximately 1.36 improving to 2.48 by Year-3 is considered acceptable for a semi-automatic poha plant.
Key Financial Ratios and Metrics for Poha Plant Appraisal
| Ratio / Metric | Formula (Simplified) | What It Indicates |
|---|---|---|
| Gross margin | Gross Profit ÷ Revenue | Basic production efficiency |
| Contribution margin | Contribution ÷ Revenue | Ability to cover fixed costs |
| EBITDA margin | EBITDA ÷ Revenue | Operating profitability before finance costs |
| Net profit margin | PAT ÷ Revenue | Bottom-line profitability |
| ROI | PAT ÷ Total Investment | Return on total capital deployed |
| ROCE | EBIT ÷ Capital Employed | Return on capital employed in the business |
| DSCR | Cash Accrual ÷ Debt Obligation | Ability to service debt |
| Interest coverage | EBIT ÷ Interest | Comfort margin for interest payment |
| Asset turnover | Revenue ÷ Total Assets | Efficiency of asset utilisation |
| Break-even capacity | BEQ ÷ Installed Capacity | Minimum utilisation for no-loss |
Banks focus especially on DSCR, interest coverage, break-even capacity and asset turnover. Promoters care more about ROI, ROCE, net margin and the projected pay back period. These ratios must be calculated on realistic financial projections – not on inflated selling prices or underestimated raw material cost. A professionally prepared poha plant project report will present these project financials and profitability ratios year-wise, along with a balance sheet and projected cash-flow statement.
Practical CA Perspective – How I Evaluate Poha Manufacturing Projects
As CA Manish Gugliya, when a promoter brings me a poha manufacturing project for appraisal, I follow a structured chain: I start from daily production capacity and installed capacity, move to raw material planning (variety, price, season), work through recovery assumptions and material balance, build a full revenue model including by-products, layer in variable and fixed costs, compute contribution and break-even, project EBITDA and profit year-wise, model cash accruals and debt servicing, and finally stress-test the numbers.
In my experience preparing project reports for MSME promoters and bank submissions, the most common issues I observe in poha plant DPRs are:
- Unrealistic conversion ratios – assuming 78–80% poha recovery when 70–74% is more prudent for most varieties and processes
- Overestimated utilisation in Year 1 – assuming 90–100% utilisation from month one, when 50–60% is typical during ramp-up
- Ignoring by-product revenue – bran and husk income, even if modest, improves contribution
- Under-provisioning working capital – paddy is seasonal, and bulk procurement needs adequate cash or cash-credit limits
An apparently attractive gross margin does not guarantee overall poha manufacturing plant profitability if the total project cost is excessive, if fixed assets are oversized for the actual market, or if working capital funding is insufficient. The poha industry operates on high volume and thin margins – profitability depends entirely on raw material procurement efficiency, operational cost control and realistic market research.
Whether you are exploring growth opportunities in the food processing industry or evaluating an existing poha unit for expansion, the fundamentals remain the same: realistic assumptions, banker-friendly project reports and transparent communication between promoters, CAs and lenders. Basic registration and compliance – FSSAI, Udyam, GST – are non-negotiable foundations, and every poha making business should treat them as prerequisites, not afterthoughts. Indian household consumption patterns, evolving food habits, and rising demand for vegetable food products including beaten rice and rice flakes continue to support stable demand – but demand alone does not create profitability. Disciplined execution does.
In this industrial world of food processing, start a poha manufacturing unit only after a thorough feasibility study. The poha processing segment is an important segment of the broader food processing industry, but like any industrial activity, it rewards preparation and punishes guesswork. Whether you are approaching a bank for a mudra loan or larger commercial production finance, the quality of your project financials and the realism of your assumptions will determine the outcome.
Frequently Asked Questions (FAQ)
These FAQs address practical doubts entrepreneurs, CAs and bankers commonly raise about poha manufacturing profitability and break-even. Answers are general and indicative – individual projects should be evaluated through a customised poha plant project report with unit-specific data.
How long does it typically take for a Poha plant to reach financial break-even?
Under realistic assumptions, many well-planned poha projects may reach accounting break-even within 1.5–3 years, depending on plant size, utilisation ramp-up, margin levels and debt burden. This is indicative and not a guarantee.
Cash-flow break-even – which includes term-loan repayment – may take somewhat longer than accounting break-even. This is precisely why banks closely examine DSCR projections for each year. Entrepreneurs should plan for adequate cushion in working capital and avoid overly optimistic timelines in their poha manufacturing DPR. The shareholding pattern and total means of finance also influence how quickly break-even is reached.
Which is more profitable – loose Poha sales or branded packaged Poha?
Loose poha typically has a lower selling price and lower packaging cost, while branded packaged poha commands a higher price but incurs additional packaging, branding and marketing expenses. If volumes sustain, branded retail poha can deliver significantly better poha plant profit margin – net margin for branded retail poha is 16–22% versus 8–11% for loose wholesale.
Many units adopt a mixed model: a base of wholesale and loose volume to maintain capacity utilisation, supplemented by selective branded retail sales for margin improvement. The right model depends on local competition, brand-building ability, distribution network, investment opportunities and working capital capacity. Market demand analysis and a market study are essential before choosing the mix.
Does location significantly affect Poha manufacturing profitability?
Location influences paddy sourcing cost, freight, access to skilled labour, power tariffs and market proximity – all of which collectively affect poha plant profitability. Plants near rice-growing belts or existing rice mills benefit from lower raw material and inward freight costs, while units close to large consumption centres save on outbound logistics.
Promoters should include a brief location analysis in their poha manufacturing business plan, balancing reliable sources of raw paddy, available infrastructure and market reach. Industry trends suggest that semi-urban locations near procurement belts often offer the best cost-to-market balance.
How do government schemes and subsidies impact Poha plant ROI?
Capital subsidies, interest subvention or margin-money support under schemes such as PMEGP, state food-processing policies or a mudra loan can improve poha manufacturing ROI by reducing effective project cost or interest burden. Some states also offer incentives specifically for the food processing industry.
However, subsidies should be treated as additional support, not the sole basis for project feasibility. The core poha plant revenue, cost and profit analysis must be viable even without subsidy. Working with an experienced CA to correctly reflect subsidy, promoter contribution and term loan in the means-of-finance section of the DPR is strongly recommended.
What simple steps can a running Poha unit take to improve profitability?
Existing units can take several practical steps:
- Negotiate better paddy procurement terms and time purchases during peak harvest
- Improve recovery through better process control (soaking, roasting temperature, roller calibration)
- Reduce fuel and power wastage through preventive maintenance and efficient burners
- Optimise manpower deployment – avoid overstaffing during lean periods
- Increase capacity utilisation by developing additional markets, institutional channels or regional brand presence
- Monetise by-products (bran, husk, broken flakes) more efficiently through reliable sources and local buyers
Existing units should periodically review their cost structure, selling prices and product mix, and prepare updated poha manufacturing financial projections at least once a year for internal planning and bank discussions. Commercial production efficiency is a continuous pursuit, not a one-time setup exercise.