
Key Takeaways
- A poha manufacturing revenue model must connect paddy input, processing yield, grade-wise saleable output, channel-wise net realisation and cash flow rather than simply multiplying installed capacity by an assumed market price.
- Poha plant profitability depends more on product mix (thick, thin, nylon, premium), capacity utilisation discipline and working capital management than on plant size alone.
- Revenue streams typically include bulk or loose poha, branded packaged poha, institutional B2B sales and private label contracts, each carrying different margins and credit cycles that affect cash flow differently.
- Assumptions on paddy price, yield, product mix and distribution channel can change poha plant revenue and profitability drastically; sensitivity analysis on these variables is essential in any bankable detailed project report.
- A phased market entry strategy with conservative capacity utilisation ramp-up is far more credible to lenders than aggressive first-year projections with no evidence of buyer commitments.
Introduction: Why the Poha Manufacturing Revenue Model Matters
In my practice as CA Manish Gugliya, I regularly see poha manufacturing project reports returned by banks because revenue assumptions are either inflated or entirely unsubstantiated. The promoter shows a large installed capacity, picks a convenient selling price from the internet, multiplies the two, and presents a turnover figure that no lender finds credible.
Poha, also known as flattened rice, rice flakes, or beaten rice, is a staple breakfast and snack food across India. Demand for poha is steady due to its staple status, particularly in states like Madhya Pradesh, Maharashtra, Gujarat, Chhattisgarh, Bihar and Uttar Pradesh. The product is nutritious, naturally gluten-free, and contains approximately 76 grams of carbohydrates, 2.6 grams of protein and 0.6 grams of fat per 100 grams, making it a light yet filling meal for millions of households.
But for a poha manufacturing unit, profitability is not automatic. It is driven by capacity utilisation, product mix, recovery and yield from paddy, selling price, packaging format, sales channel and the ability to manage working capital. A serious poha plant project report must track saleable output and net realisation after trade margins and freight, not simply assume installed capacity multiplied by 365 days multiplied by an average selling price.
This article focuses on the poha manufacturing revenue model, poha plant product mix and poha manufacturing market strategy from a bank-finance and DPR preparation perspective. If you are an entrepreneur, rice miller, MSME promoter or consultant preparing a project report for a poha manufacturing business, this is the commercial and financial framework you need before touching Excel.
Understanding the Core Poha Manufacturing Revenue Model
The basic revenue equation for any poha plant is straightforward:
Sales Volume (kg) × Net Realisation per kg = Gross Operating Revenue
The complexity lies in estimating each component honestly.
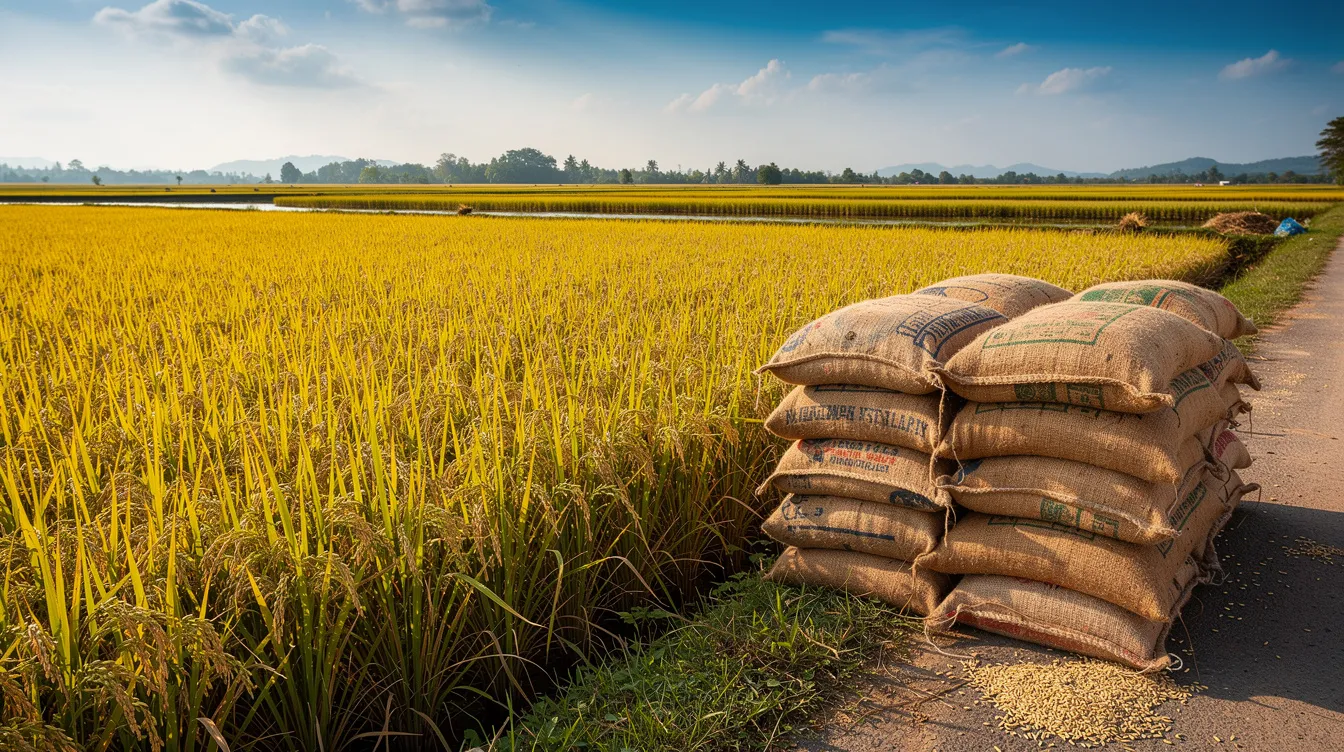
Consider a plant with 24 tonnes per day (TPD) installed capacity operating 300 days per year. Theoretical annual capacity is 7,200 tonnes. But if realistic capacity utilisation in Year 1 is 50%, the achievable production drops to 3,600 tonnes. After accounting for process loss, breakage and downgrading into lower-grade flakes, saleable premium output may be only 3,000 to 3,200 tonnes.
Now layer on the fact that not all output fetches the same price. Thick poha sold in bulk to a mandi trader realises a different rate than thin nylon poha packed in branded 1 kg retail pouches. Net realisation must account for distributor margin, retailer margin, trade discounts, freight, packaging cost, returns and credit notes.
A bankable DPR should therefore differentiate clearly between:
- Theoretical production capacity (what the machinery can produce)
- Saleable output (after quality checks, breakage, grading)
- Invoiced sales (after trade terms and discounts)
- Net revenue realisation (what actually reaches the manufacturer’s account)
Revenue should be modelled monthly or quarterly in the initial years, reflecting expected ramp-up rather than a flat full-year assumption from Day 1.
Main Revenue Streams in a Poha Manufacturing Plant
A poha manufacturing business typically earns from four to five streams rather than a single line of sales. Combining them strategically improves both turnover and plant profitability.
The main revenue sources are:
- Bulk or loose poha sales
- Branded packaged poha (retail)
- Institutional and B2B sales
- Private label manufacturing
- Minor by-product income (husk, broken flakes)
Each stream will be discussed below with its typical margin characteristics, working capital implications and relevance across different scales of poha plants. A well-structured poha manufacturing revenue model should estimate separate prices and volumes for each stream in the financial projections.
Bulk / Loose Poha Sales as a Base Revenue Line
The bulk model involves selling poha in 25 kg or 50 kg bags to mandi traders, wholesalers, snack manufacturers, namkeen units and regional food-grain distributors. Customers include namkeen manufacturers in cities like Indore, Nagpur and Surat who buy thick poha in volume for chivda and snack mixes, as well as food processors requiring consistent supply.
This channel gives lower per-kg realisation than packaged retail. Sample project models suggest net margins of roughly 8–11% for bulk or loose poha sales at small-to-medium scale. However, bulk sales offer high volumes, quicker market penetration and relatively lower branding cost.
Working capital in this channel involves payment cycles of 7 to 30 days, relatively lower marketing expense, but significant price sensitivity and competition from other local poha mills. Most new poha plants in India should plan at least 50 to 70 percent of initial revenue from bulk sales to stabilise capacity utilisation before investing heavily in retail branding.
Branded Packaged Poha and Retail Revenue
Branded packaged poha represents a higher-realisation revenue stream. Retail packs of 500 g, 1 kg and 2 kg sold through kirana stores, supermarkets and online platforms can command significantly better per-kg pricing. For context, approximately 42% of urban South Asian consumers buy packaged poha weekly, indicating strong recurring demand for branded products.
However, net benefit must be evaluated after accounting for primary and secondary packaging cost, distributor margin (often 10–20%), retailer margin (15–25%), promotional discounts and logistics. For instance, Rajdhani Thick Poha 1 kg retails at an MRP of approximately ₹160 but sells around ₹108 under discount, and the manufacturer’s ex-factory realisation is considerably lower still.
Common positioning options include economy brand poha for rural and semi-urban markets, mid-segment regional brands, and premium cleaned or nylon poha targeting urban health-conscious consumers pursuing clean label preferences. Branded retail packaging can result in significantly higher profit margins compared to bulk sales, but it requires consistent product quality, attractive packaging and patience for brand-building over 18 to 36 months.
Over time, packaged poha can gradually become 30 to 50 percent of revenue for a regional brand plant.
Institutional and B2B Poha Sales
Institutional customers include namkeen and snack manufacturers, breakfast-mix companies, hotel and restaurant chains, corporate caterers, hostels, educational institutions and canteens using poha as a breakfast staple or ingredient.
B2B contracts can provide stable, repeat orders but usually at negotiated prices with strict quality specifications for thickness, broken percentage and moisture content. The poha manufacturing sales strategy for this channel should focus on supply reliability, consistent grade and technical parameters rather than retail-style branding.
Credit periods are typically longer in this segment, often 30 to 60 days, so DPR working capital planning should separately consider institutional receivables. Medium-scale plants targeting improved poha plant revenue and profitability should try to secure at least a few anchor institutional clients before investing in large-scale retail expansion. Net margins in institutional supply tend to fall in the 12 to 16 percent range.
Private Label and Third-Party Poha Manufacturing
Private label manufacturing involves producing rice flakes and instant poha for supermarket brands, quick-commerce platforms or regional grocery chains under their labels. This approach offers assured volumes, lower marketing spend, better utilisation of poha production capacity and relatively stable cash flows when contracts are well-structured.
The limitations are real: lower brand equity for the manufacturer, tighter margins and dependence on a few clients. If a large private-label buyer exits, the manufacturer faces a sudden capacity gap. For example, supplying poha under private labels to regional supermarket chains in Madhya Pradesh or Maharashtra can provide volume stability, but it also creates concentration risk.
In a poha manufacturing DPR, private-label revenue should be shown separately with its own pricing, packing specifications and credit terms.
By-Product and Secondary Revenue in Poha Manufacturing
The milling process generates by-products that can add revenue streams. These include husk from paddy processing, broken poha (chura) and fines that can be used in cattle feed or low-priced snack applications. By-product utilization can improve overall plant economics rather than being treated as waste.
However, by-product income typically adds only 1 to 3 percent of total revenue. It should not be overestimated or used to artificially inflate project profitability. In lender discussions, it is safer to treat by-product income as a cushion rather than as a core element of the poha plant revenue and profitability model. Include a modest, evidence-based assumption supported by local buyer quotes or existing rice mill linkages.
Poha Plant Product Mix and Grade Planning
The poha plant product mix is central to revenue modelling and capacity utilisation. Different grades of flattened rice products serve different applications. Thick poha is used for chivda and snacks, medium for household breakfast, and thin and nylon grades for ready-to-eat or instant poha products. Poha is made by parboiling and flattening raw rice, and flaking rollers determine the thickness of the final flakes, making equipment configuration an important decision.
Introducing value-added products like fortified poha or instant poha mixes can shift a business from commodity processing to brand differentiation. Fortified poha, which includes iron, zinc and vitamins to combat nutrient deficiencies, is the fastest-growing segment with a CAGR of 9.4%. It commands a manufacturing premium of 12 to 15 percent over conventional poha. Red poha, richer in antioxidants and with a lower glycemic index, is another emerging niche.
Product quality attributes such as flake thickness and cleanliness are key to consumer preference. The product mix must also reflect the flexibility of machinery required for Poha manufacturing.
| Product Type | Typical Customer | Relative Selling Price | Margin Potential | Packaging Requirement | Sales Volume Potential |
|---|---|---|---|---|---|
| Thick Poha (Bulk) | Traders, namkeen units | Low–Medium | Moderate | 25/50 kg bags | High |
| Medium Poha (Retail) | Households, kirana stores | Medium | Good | 500 g / 1 kg pouches | Medium–High |
| Thin / Nylon Poha | Urban retail, premium buyers | High | High | Branded retail packs | Medium |
| Instant Poha Mix | Urban consumers, e-commerce | High | High | Value-added packs with spices | Low–Medium |
| Fortified Poha | Health-conscious, institutional | High | High (premium segment) | Retail / institutional packs | Growing |
Thick vs Thin vs Nylon Poha – Regional and Application Strategy
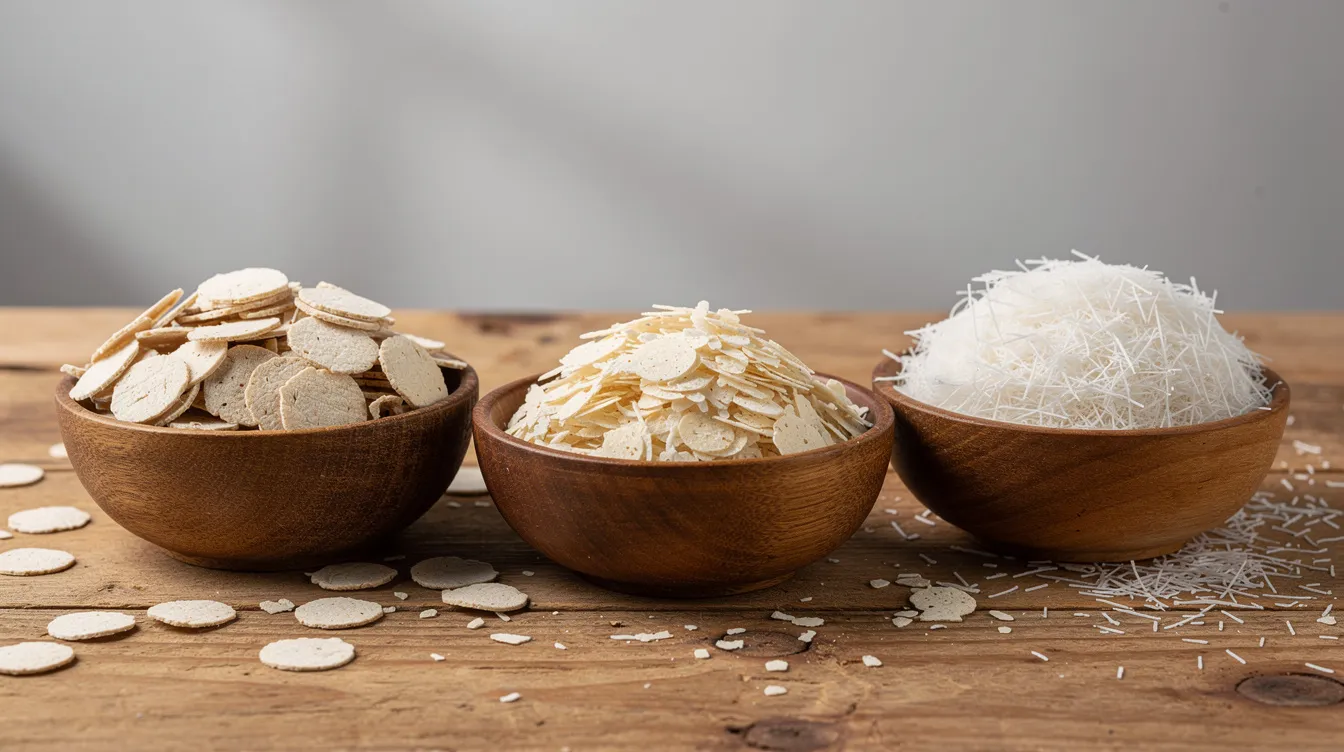
Demand for thick, thin and nylon poha varies by state and cuisine. Thick poha is widely used for chivda and namkeen in Maharashtra and Gujarat. Medium poha is a common breakfast choice in Madhya Pradesh. Nylon and thin grades are preferred in instant poha mixes and by health-conscious urban consumers.
Before freezing equipment configuration and expected grade-wise output, promoters should conduct market research in target districts such as Indore, Bhopal, Nagpur, Ahmedabad and Jaipur. Snack manufacturers prefer consistent thickness and lower breakage, while retail customers focus on cleanliness, colour and cook time (poha typically requires only hot water to prepare).
A practical approach is to start with two to three main grades and later add specialised nylon or premium clean poha as the market matures and brand recognition builds. This keeps initial investment in grading equipment manageable while allowing growth opportunities as demand evolves.
Bulk Poha vs Packaged Poha – Revenue and Margin Comparison
Many entrepreneurs ask whether loose poha or branded packaged poha is more profitable. The answer depends on volumes, branding capability, cash-flow management and the promoter’s willingness to invest in the long game.
| Parameter | Bulk / Loose Model | Branded Packaged Model |
|---|---|---|
| Net Realisation per kg | ₹30–₹45 (indicative) | ₹80–₹120+ (indicative) |
| Packaging Cost per kg | Minimal | Significant (pouch, label, carton) |
| Marketing Spend | Low | Medium–High |
| Dependence on Traders | High | Lower (direct retail reach) |
| Brand Equity | None | Builds over time |
| Credit Period | 7–30 days | 30–60+ days |
| Typical Net Margin | 8–12% | 16–22% |
Bulk poha favours faster volume with lower per-kg margin, while packaged poha offers higher net realisation but requires time, investment and professional distribution management. Many plants adopt a hybrid model where 60 to 70 percent of production is sold as bulk or loose initially, with 30 to 40 percent gradually shifting into branded packs and instant poha SKUs.
Suggested Product Mix by Scale of Poha Manufacturing Business
The ideal product mix depends on the scale of the poha manufacturing unit:
Small / Local Plant (2–5 TPD): A 500 kg/day poha mill setup costs approximately ₹5–10 lakh and produces about 13 tonnes monthly. Such a startup should focus on majority bulk sales within a 100 to 150 km radius, with limited local retail packing in one or two SKUs. Monthly profit potential for a poha unit of this scale ranges from ₹40,000 to ₹1.2 lakhs depending on utilisation and cost discipline.
Medium-Scale Plant (10–20 TPD): A mix of wholesale, institutional, own mid-range brand and some private-label contracts works well. Diversify geography to neighbouring states, invest in two to three packaging formats and build a small distributor network.
Larger Regional Brand (25–50+ TPD): Broader product portfolio including premium nylon poha, cleaned poha, instant poha cups or mixes. Strong distributor network, presence in modern trade and e-commerce. Organic and fortified variants can be introduced at this scale.
Actual product mix must be derived from local demand, equipment flexibility, capacity planning for a Poha plant and promoter capability. These scenarios are illustrative, not prescriptive.
Capacity Utilisation Planning and Its Impact on Revenue
Effective utilization of production capacity drives revenue potential in manufacturing operations, but no new poha manufacturing business should assume 100 percent capacity utilisation from the first year. A phased ramp-up approach is both realistic and credible:
- Year 1: 40–60% (stabilisation, customer acquisition, quality consistency)
- Year 2: 60–75% (distributor growth, repeat orders)
- Year 3: 75–90% (brand recognition, channel maturity)
Factors influencing achievable utilisation include the promoter’s existing customer base, competition intensity, product quality stability, adequacy of working capital and strength of the distribution channel. Bankers examine the relation between installed capacity, actual sales volume and revenue projections; overaggressive utilisation numbers raise credibility concerns immediately. Break-even for many small-medium plants occurs at roughly 50 to 55 percent utilisation.
Estimating Saleable Production: From Paddy Input to Rice Flakes Output
Paddy procurement volume, moisture content, husk removal, roasting and flaking losses together determine the net poha yield. Processing yield typically ranges between 60% and 70% depending on grain quality, paddy variety and process discipline. The soaking process lasts approximately 3 to 4 hours, and roasting occurs at temperatures between 180°C and 220°C before the flaking stage.
Understanding the Poha manufacturing process flow chart is essential because each step affects breakage and recovery. Overstating yield by even a few percentage points can falsely inflate projected turnover, which creates problems during bank appraisal.
The paddy procurement and raw material planning strategy is a key input before calculating saleable rice flakes tonnage in the DPR. Use cleaned paddy of consistent quality to improve recovery rates.
Poha Selling Price and Net Realisation Strategy
Pricing strategy must balance raw-material costs and competitor pricing. The selling price should be built starting from paddy procurement cost, adding processing cost per kg (covering power, fuel, manpower and overheads from operating utility requirements of a Poha plant), packaging, desired contribution margin and then aligning with prevailing market rates.
Paddy quality and procurement price constitute the largest variable expense in poha production. A change of ±10–15% in paddy input cost shifts margins significantly.
The critical distinction every promoter must understand:
- Ex-Factory Price: What the manufacturer invoices
- Distributor Price: Ex-factory minus distributor margin
- Wholesale Price: What a mandi trader charges sub-dealers
- Retail / MRP: Consumer-facing maximum price
- Net Realisation: What actually reaches the manufacturer after all deductions
Deductions from MRP include GST where applicable, distributor margin (10–20%), retailer margin (15–25%), schemes and discounts, freight and secondary packaging. In the DPR, separate average selling prices should be taken for bulk poha, branded retail poha and B2B institutional segments to refine the revenue model.
Illustrative Poha Plant Revenue Model (Worked Example)
The following is a purely illustrative, hypothetical example for educational purposes only:
| Parameter | Value |
|---|---|
| Installed Capacity | 24 TPD |
| Operating Days per Year | 300 |
| Annual Theoretical Capacity | 7,200 tonnes |
| Year 1 Capacity Utilisation | 60% |
| Achievable Production (before loss) | 4,320 tonnes |
| Yield / Recovery (indicative 65%) | 2,808 tonnes saleable poha |
| Bulk Poha Share (70%) | 1,966 tonnes |
| Packaged Poha Share (30%) | 842 tonnes |
| Avg Net Realisation – Bulk | ₹38/kg |
| Avg Net Realisation – Packaged | ₹95/kg |
| Bulk Revenue | ₹7.47 crore |
| Packaged Revenue | ₹8.00 crore |
| Total Estimated Revenue (Year 1) | ₹15.47 crore |
Figures are purely illustrative; promoters must base actual projections on quotations and local market research.
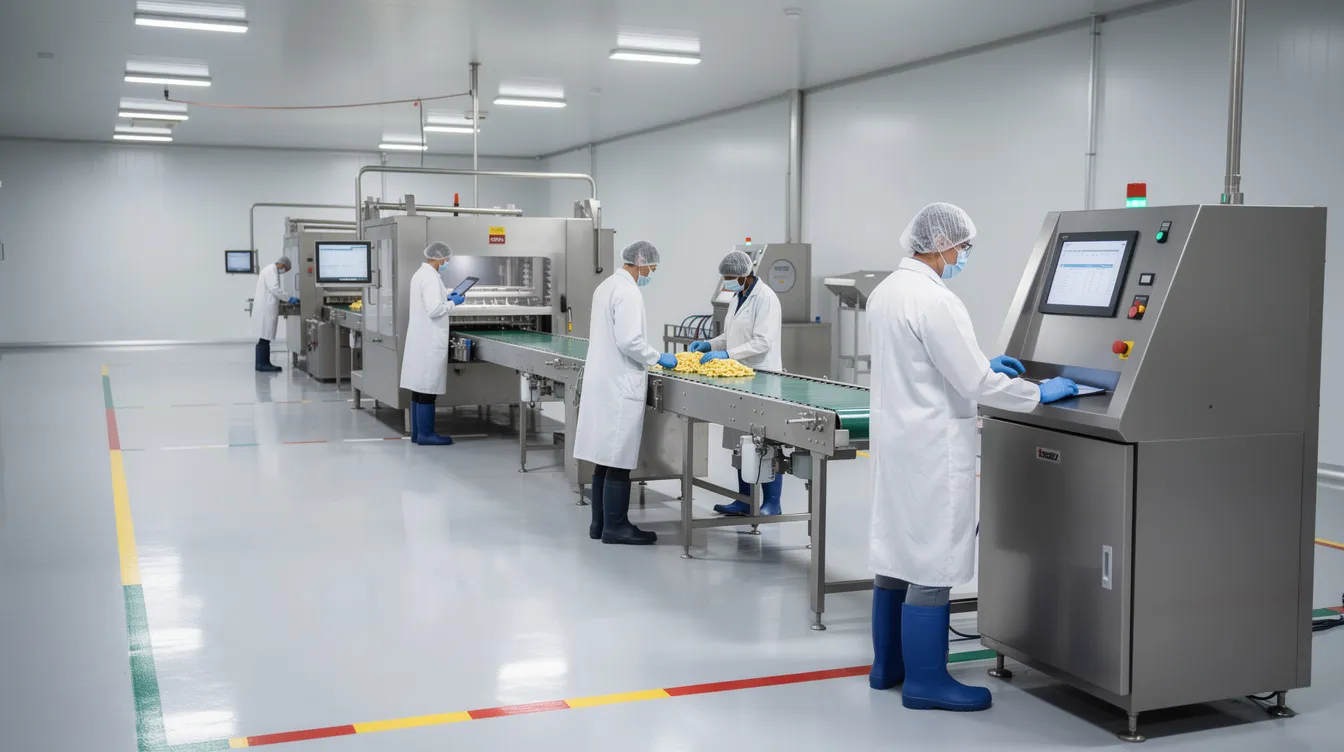
Notice how small changes matter: if capacity utilisation drops from 60% to 50%, total revenue falls by roughly ₹2.5 crore. If average realisation on packaged poha drops by ₹10/kg, revenue reduces by another ₹84 lakh. These swings directly affect DSCR and loan repayment ability.
Product-Wise Revenue Mix and Contribution
| Product | Share of Production (%) | Saleable Qty (tonnes/yr) | Net Realisation (₹/kg) | Est. Revenue (₹ lakh) | % of Total Revenue |
|---|---|---|---|---|---|
| Thick Poha – Bulk | 45% | 1,264 | 36 | 455 | 29.4% |
| Medium Poha – Retail 1 kg | 25% | 702 | 95 | 667 | 43.1% |
| Thin/Nylon Poha – Premium | 15% | 421 | 120 | 505 | 32.7% |
| Instant Poha Mix | 5% | 140 | 150 | 210 | 13.6% |
| By-product (chura/fines) | ~10% (of input) | 280 | 18 | 50 | 3.2% |
Indicative figures only. Actual product-wise analysis should form part of every professional poha manufacturing DPR.
This table demonstrates how a smaller volume premium product like nylon poha or instant poha can contribute a disproportionately higher share of total revenue compared to high-volume bulk poha.
Poha Market Analysis in India – Demand Drivers and Trends
The global poha market was valued at $1.8 billion in 2025 and is projected to reach $3.1 billion by 2034, expanding at a CAGR of 6.2% from 2026 to 2034. Asia Pacific accounts for approximately 68.7% of global poha revenues, with India being the dominant market. The household segment accounted for 62.7% of poha market revenues in 2025.
Key demand drivers in India include:
- Traditional household consumption of poha as breakfast and snack across central, western and northern regions
- Growing domestic demand from the snack and namkeen industry for thick poha as a base ingredient
- Rising urban demand for convenient, instant and ready-to-cook poha variants
- Expansion in the packaged poha market in India through modern trade and e-commerce, especially in Tier-1 and Tier-2 cities
- Institutional consumption through restaurants, canteens, hostels and corporate cafeterias
Demand for poha peaks during festive seasons and winter months when household consumption increases. Even internationally, North America holds 11.4% of the global poha market share in 2025, reflecting the export potential of the product among diaspora communities.
The poha business market opportunity remains strong but is increasingly quality- and brand-sensitive rather than price alone.
Regional Market Considerations for Poha Manufacturing
Poha market demand and preferred grade vary significantly by state and even district. Madhya Pradesh, Maharashtra, Gujarat and Chhattisgarh have a strong poha consumption culture, while regions in Rajasthan, Uttar Pradesh and Bihar also show steady regional demand.
Some units locate near paddy-growing belts (Chhattisgarh, eastern MP) for raw material cost advantage, while others position near urban consumption centres like Pune, Mumbai, Ahmedabad and Jaipur. Location in major paddy-producing areas can reduce transport costs and enhance profitability significantly.
Before finalising project capacity and product mix, conduct a regional poha market analysis that includes mapping existing mills, trader networks and branded players in the target area. Shipping low-value bulk poha over 700 to 800 km can erode margins, which is why regional clustering of poha manufacturing units is common across India.
Target Customer Segments for a Poha Manufacturing Business
Key customer groups for any poha plant include:
- Local wholesalers and food-grain distributors
- Kirana shops and supermarkets
- Online grocery platforms (online retail for poha is growing at a CAGR of 9.8% through 2034)
- Namkeen and snack manufacturers
- HORECA sector (hotels, restaurants, caterers)
- Institutional canteens, hostels and educational institutions
- Private-label brands and quick-commerce platforms
Each segment requires a slightly different product specification, packaging and credit policy to optimise poha manufacturing income and cash flow. Promoters should prepare a simple customer-segmentation plan in the DPR, indicating estimated volumes per segment and rationale for the chosen distribution channel mix. Diversifying between B2B and B2C customers reduces overdependence on any single buyer type.
Distribution and Sales Channel Strategy
| Channel | Margin to Manufacturer | Marketing Cost | Credit Period | Volume Potential | MRP Control |
|---|---|---|---|---|---|
| Direct Wholesale (Mandi) | Low–Moderate | Very Low | 7–15 days | High | None |
| Distributor/Dealer Network | Moderate | Medium | 15–45 days | High | Partial |
| Institutional B2B | Moderate | Low | 30–60 days | Medium–High | None |
| Modern Trade | Moderate–Good | High | 45–60 days | Medium | Yes |
| E-Commerce / Online | Good | High | Platform-dependent | Growing | Yes |
| Private Label | Low–Moderate | Minimal | 30–45 days | Medium–High | None |
The poha plant sales strategy should align with promoter strengths. A rice miller with existing mandi relationships may start with wholesale, while a promoter with FMCG experience may push branded retail and modern trade sooner. Market accessibility can be increased through a strong distribution network and logistics management. Each channel combination affects working capital needs, so the channel mix must be coordinated with bank-finance planning.
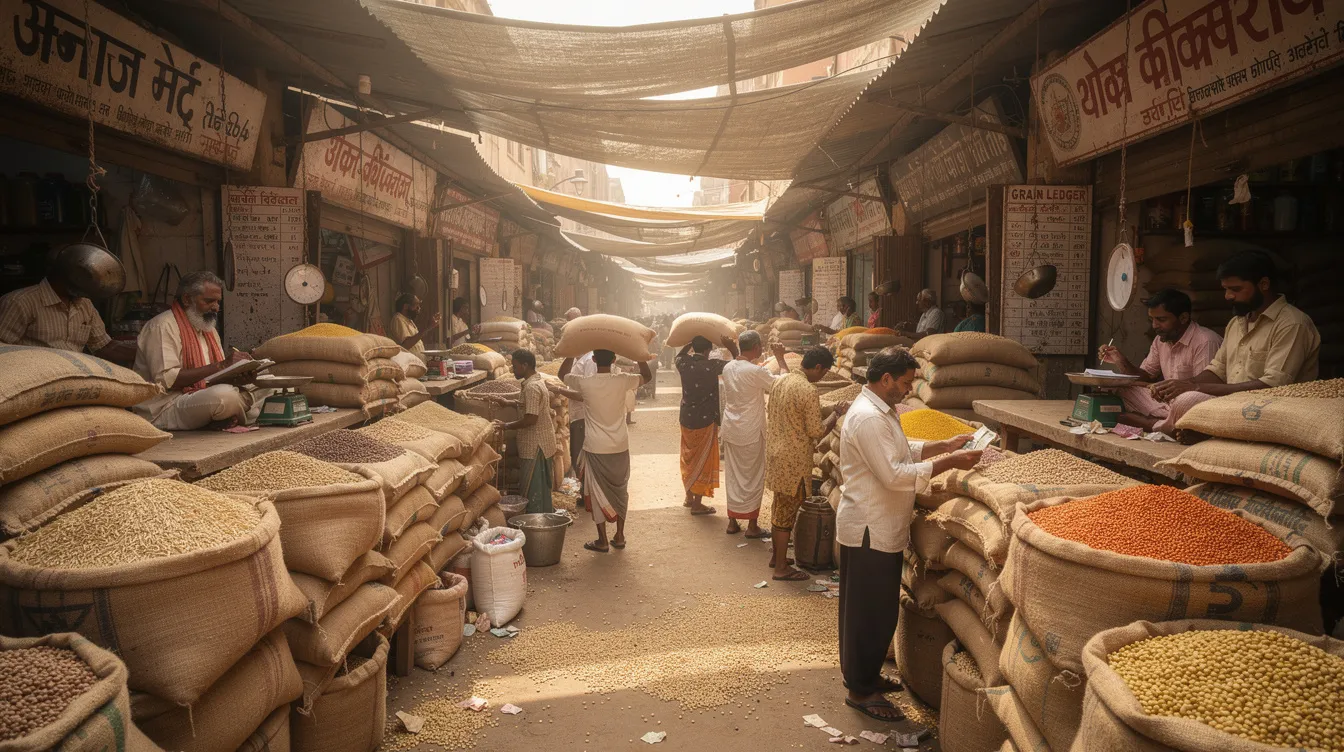
Geography, Freight and Plant Location Strategy
Poha is a low-to-medium value staple where freight per kg is a critical factor in net realisation, especially for bulk and institutional supplies. The typical sourcing radius for paddy is 50 to 150 km, while the market radius for bulk products might extend to 200 to 400 km before margins become uncomfortable.
Plant location decisions must integrate Poha plant land and building requirements. Calculate approximate freight per kg for your key markets and reflect this in selling-price and contribution analysis within the DPR. A poorly located plant can lose ₹2–4 per kg on freight alone, which across thousands of tonnes per year becomes a material drag on profitability.
Brand Positioning and Packaging Strategy
Positioning options range from economy poha for price-sensitive rural buyers to premium hygienically processed or cleaned poha for modern retail and e-commerce customers. Branding and perceived quality can significantly influence customer willingness to pay a premium.
Packaging formats directly impact per-kg realisation:
- Bulk sacks (25/50 kg) for wholesale and institutional
- 500 g and 1 kg retail pouches for kirana and supermarket store shelves
- 2 kg family packs for value-conscious households
- Specialty packs with spices for instant poha variants
Attractive packaging and clear labeling can differentiate a product in commodity markets. Compliance with FSSAI food safety standards is required for food businesses in India, and prominently displaying certifications builds consumer trust. Packaging material inventory can tie up significant working capital, especially for multi-SKU branded poha product portfolios.
Pricing and Competition Strategy in the Poha Market
Competing solely on lowest price generally erodes margins and may create difficulties in loan servicing. Profit margins in the poha manufacturing industry can be tight, so sustainable differentiation matters.
Focus instead on consistent quality, regular supply, courteous service to traders and flexible grade-wise offerings. Premiumisation through better cleaning, grading, packaging and branding can support slightly higher prices and improved poha manufacturing profit margin. The DPR should include a brief competitor benchmarking section summarising prevailing prices of three to four competing products in the target regions.
Market Entry Strategy for a New Poha Plant
A phased approach reduces initial market-risk exposure:
- Phase 1 (Months 1–6): Secure bulk buyers and local mandi traders. Focus on process stabilisation and consistent output quality.
- Phase 2 (Months 4–12): Build a small network of regional distributors. Develop relationships with two to three institutional buyers.
- Phase 3 (Months 9–18): Launch limited branded retail SKUs (one to two products). Test in local markets before scaling.
- Phase 4 (Months 12–24): Expand geography, add B2B institutional sales and refine marketing strategies based on market feedback.
- Phase 5 (Months 18–36): Explore private-label opportunities, modern trade listings and e-commerce for growth.
Realistic timeframes of 12 to 24 months for meaningful market penetration should be used in revenue projections. Understanding seasonal fluctuations can influence production scheduling and inventory management during this ramp-up.
Revenue Risk Factors and Mitigation Strategies
| Risk Factor | Potential Impact | Mitigation Strategy |
|---|---|---|
| Raw material price volatility | Direct margin erosion | Staggered procurement, supplier relationships, seasonal storage |
| Lower-than-expected recovery | Reduced saleable output | Process optimisation, better paddy grading, equipment maintenance |
| Aggressive price competition | Margin compression | Quality focus, branding, customer loyalty |
| Delayed receivables | Cash flow stress | Credit limits, advance collection for new buyers, distributor deposits |
| Freight escalation | Lower net realisation | Regional market focus, freight-inclusive pricing |
| Packaging cost increase | Higher per-kg cost | Bulk purchasing, long-term vendor contracts |
| Inconsistent quality | Customer attrition | Process discipline, trained manpower, quality checks |
| Regulatory changes | Compliance cost | Proactive FSSAI compliance, documentation |
Diversification of product mix, customer base and geographic regions can reduce revenue volatility. Banks appreciate when a DPR clearly acknowledges risks and outlines practical mitigation steps rather than projecting a perfect scenario.
Working Capital Impact of Sales and Distribution Strategy
Faster revenue growth is positive only if supported by adequate working capital for paddy inventory, packaging material, finished goods and receivables. Bulk mandi sales may involve shorter credit but more price volatility, while modern retail and institutional sales often mean longer credit periods.
Seasonal paddy procurement can create peak working capital requirements during harvest months (October to January in many regions), requiring the manufacturer to store raw material for several months of production. Cash flow statements and working capital assessment must be consistent with the chosen poha plant market strategy in the DPR.
High sales do not automatically mean strong cash flow. A company selling ₹1 crore per month but collecting in 60 days needs roughly ₹2 crore locked in receivables alone, before considering raw material and packaging stock.
Integrating Revenue Model into a Bankable Poha DPR
Lenders look for specific elements in poha plant project reports:
- Realistic capacity utilisation with phased ramp-up
- Justifiable selling prices backed by market evidence
- Clear product mix with grade-wise allocation
- Evidence of market demand (enquiry letters, trader feedback)
- Linkage between revenue assumptions and promoter’s strengths
Key assumptions that must be disclosed: paddy price per quintal, expected yield percentage, grade-wise product mix, channel-wise sales volumes, average realisation per kg, credit terms and marketing expense.
Supporting documents include local mandi price trends, enquiry letters from potential buyers, quotations for packaging and freight rates, and competitor price benchmarks. The Poha plant project cost and means of finance must align with revenue projections to produce a credible repayment schedule. The total project cost, investment structure and loan amount should all flow logically from the revenue model.
Revenue Model, Profitability and DSCR Linkage
Gross revenue flows into contribution, EBITDA, profit after tax and ultimately into cash accruals for servicing term loans and working capital interest. Lenders test the poha plant financial projections by stress scenarios on selling price, raw material cost and utilisation to measure the impact on Debt Service Coverage Ratio (DSCR).
A small reduction in realisation-say ₹3 per kg-or a drop in utilisation from 70% to 55% can significantly reduce DSCR below the 1.5x threshold many banks require. It is safer to project conservative yet achievable profitability figures and let the upside serve as a buffer for the promoter rather than baking optimism into the base case.
Including a sensitivity table in the DPR showing DSCR under base, optimistic and conservative revenue scenarios strengthens the document significantly.
Common Mistakes in Poha Revenue Projections
In my practice, I frequently encounter these errors:
- Assuming 100% capacity utilisation from Year 1 without evidence of buyer commitments
- Taking retail MRP as manufacturer’s net realisation, ignoring that 30–40% may be consumed by channel margins
- Excluding freight cost from the revenue or cost model
- Assuming all output is premium-grade, when breakage and quality variation are inevitable
- Overestimating by-product income without actual buyer quotes
- Underestimating packaging cost, especially for multi-SKU retail product portfolios
- Assuming cash sales where the market typically operates on credit
- Failing to prepare a competitor analysis or industry overview for the target geography
Cross-check all per-kg contribution calculations and ensure internal consistency of the detailed project report. Use conservative assumptions to ensure the project can still service debt under normal market fluctuations.
Practical Guidance from CA Manish Gugliya
In every poha manufacturing DPR assignment I handle, I start with raw material and process parameters before touching turnover figures. The logical chain is clear:
Paddy Procurement → Poha Manufacturing Process and Yield → Grade-wise Output → Product Mix → Channel-wise Sales → Net Realisation → Revenue → Gross Margin → Operating Costs → Profitability → Cash Flow → Debt Servicing
Here are observations from my experience:
I once reviewed a project where the promoter had assumed 90% capacity utilisation and premium-grade realisation from Year 1. The bank returned the document. We reworked it with realistic 55% utilisation and a solid base of bulk buyers already confirmed. The revised DPR was accepted and the loan sanctioned within two months.
In another case, a promoter in a paddy-growing district had excellent raw material access but no distribution plan for packaged poha. We structured the DPR around 80% bulk and 20% packaged with a clear Phase 2 plan for branded retail. The honest approach was appreciated by the bank’s technical team.
Revenue modelling should be treated as an iterative exercise refined with market feedback, not a one-time Excel file created only to satisfy loan documentation. Build it from operations upward; never start with a desired turnover and work backward.

If you are serious about setting up a profitable poha manufacturing unit, prepare your revenue model with the same rigour you would apply to any commercial enterprise. The numbers must tell a story that is both ambitious enough to justify the investment and honest enough to survive a banker’s scrutiny.
FAQs – Poha Manufacturing Revenue, Product Mix and Market Strategy
Is a Poha manufacturing business profitable in India?
Poha manufacturing can be profitable if the plant runs at reasonable capacity utilisation, paddy is procured efficiently and selling prices cover full costs including packaging, freight, interest and depreciation. Net margins vary by model: bulk operations typically earn 8 to 12 percent, while branded packaged poha can yield 16 to 22 percent at reasonable scale. Monthly profit potential for a small-scale 500 kg/day unit ranges from ₹40,000 to ₹1.2 lakhs. Medium-term profitability also depends on controlling working capital costs and maintaining consistent product quality to avoid market returns. Every promoter must prepare a customised detailed project report rather than relying on generic margin claims found online.
How should I estimate the selling price of Poha for my project report?
Start from current paddy prices in your target procurement markets. Add estimated processing cost per kg covering utilities, manpower, overheads, packaging and desired contribution margin. Then visit local wholesalers and retailers to note actual market prices for comparable grades of poha. For packaged products, deduct distributor margin, retailer margin, promotional discounts and freight from the retail MRP to arrive at your net manufacturer realisation. Confirm these assumptions with at least a few prospective channel partners before finalising the DPR. Regional variations can be significant, so cross-check with two to three wholesale markets in your target states.
What capacity utilisation is realistic to assume in the first three years?
There is no single standard. Realistic utilisation depends on plant size, the promoter’s prior market links, local competition and whether bulk buyers are already lined up. Many new plants operate at 40 to 60 percent of technical capacity in Year 1, with gradual ramp-up as distribution and brand recognition improve. Some reference models use 60% in Year 1 rising to 75% in Year 2 and 88% in Year 3. Lenders prefer conservative, well-explained ramp-up plans backed by a clear market-entry strategy over aggressive assumptions without supporting evidence. The payback period for most poha plants falls in the 4 to 6 year range.
Is private-label Poha manufacturing viable for small and medium plants?
Private label manufacturing can be viable for medium-scale plants that have surplus capacity and want assured volumes without heavy branding expenditure. Advantages include stable orders, lower marketing cost and predictable cash flows. However, margins are typically thinner than own-brand sales, and the manufacturer builds no brand equity of its own. The key risk is dependency-if a large private-label client exits, the plant faces a sudden capacity gap. A balanced approach is to limit private-label to 15 to 25 percent of total output while building your own brand in parallel.
What information is needed to prepare a bankable Poha manufacturing DPR?
Essential inputs include proposed capacity details, technology and machinery specifications, raw material sourcing plan with paddy availability in the region, land and building layout, utilities and manpower requirements, proposed product mix, target markets and customer segments, estimated selling prices and preliminary buyer feedback. Financial details required include promoter’s equity contribution, proposed bank finance structure, expected working capital cycle, projected profit and loss statements, cash flows and sensitivity analysis on key revenue assumptions including selling price, paddy cost and capacity utilisation. Entrepreneurs who are serious about this venture should compile this information early and seek professional help in structuring the DPR and CMA data for bank submission.
Conclusion and Professional Call to Action
Long-term success of a poha plant comes from integrating paddy procurement, efficient processing, realistic recovery assumptions, a carefully chosen product mix, disciplined pricing, a strong distribution network and robust financial planning. The poha manufacturing revenue model is not an afterthought-it is the backbone of bankability, DSCR adequacy and promoter returns.
If you are an entrepreneur, MSME promoter, rice miller or consultant planning a poha manufacturing project in India, I would encourage you to invest time in building your revenue assumptions from the ground up. A credible DPR connects raw material to cash flow, and every assumption in between should be defensible.
For professional assistance with poha manufacturing project reports, CMA data preparation, financial projections, feasibility analysis, working capital assessment and bank finance planning, you can reach out to me through ProjectReportBank.com. While professional DPR support can significantly improve the quality and credibility of your proposal, I want to be clear: no consultant can or should guarantee loan sanction or fixed profitability. Market risk always remains, and the best we can do is prepare you to face it with realistic numbers and a sound strategy.
– CA Manish Gugliya