
Key Takeaways
- Value added dairy plant profitability depends primarily on milk procurement cost, product mix, capacity utilisation and cold chain logistics rather than selling price alone. The profitability of a value-added dairy plant relies on operational efficiency and market positioning, not assumptions about high MRPs.
- A proper dairy plant break even analysis and contribution margin study are essential before investing ₹10–₹50 crore in an industrial value-added dairy plant in India. Value addition does not guarantee higher profit; it requires careful capital and operational management.
- Even a small change of ₹1–₹2 per litre in raw milk cost or net selling price can change annual profit by several crores for a 50,000 LPD dairy processing unit.
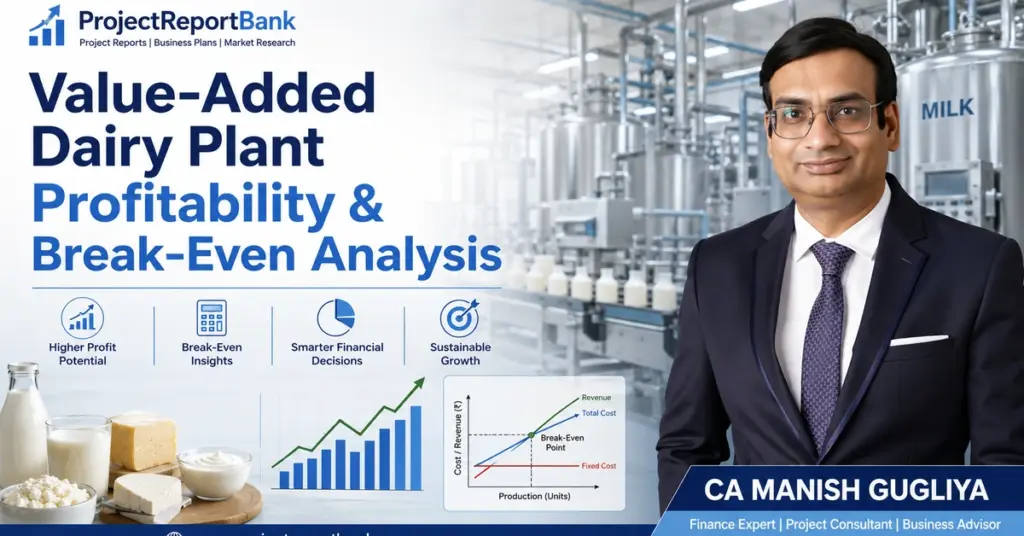
- This article is written from the perspective of CA Manish Gugliya, focusing on practical DPR, CMA Data and bankable financial projections rather than generic dairy farming advice.
- All numerical examples are illustrative only. Actual dairy plant cost and profit analysis depends on location, technology, financing and market conditions.
Introduction: Understanding Value Added Dairy Plant Profitability in India
Converting raw milk into value added dairy products such as paneer, curd, yogurt, Greek yogurt, probiotic drinks and lassi can significantly increase revenue realisation per litre of milk for Indian dairy processing plants. The Indian dairy market is projected to grow from INR 21,318.5 billion to 57,859.1 billion by 2034 at a CAGR of 11.73%, creating substantial opportunity. Converting raw milk into value-added products yields higher profit margins compared to liquid milk, and operating a dairy plant can achieve substantial economies of scale compared to dairy farming alone.
However, higher MRP does not automatically mean higher profit margin. Value addition introduces:
- Processing and packaging cost
- Refrigeration and cold chain distribution expenses
- Product losses, returns and expiry write-offs
- Marketing, branding and trade margin payouts
- Additional manpower and quality control costs
- Higher capital expenditure and working capital requirements
Profitability in value-added dairy ventures varies widely based on marketing decisions and scale. Indian entrepreneurs often underestimate cold chain power costs, product returns and dealer margins when calculating dairy manufacturing business profit.
Break-even analysis, contribution margin and capacity utilisation are the core tools for dairy plant financial analysis. The rest of this article builds a systematic framework for evaluating these metrics before committing capital.
Key Drivers of Value Added Dairy Plant Profitability
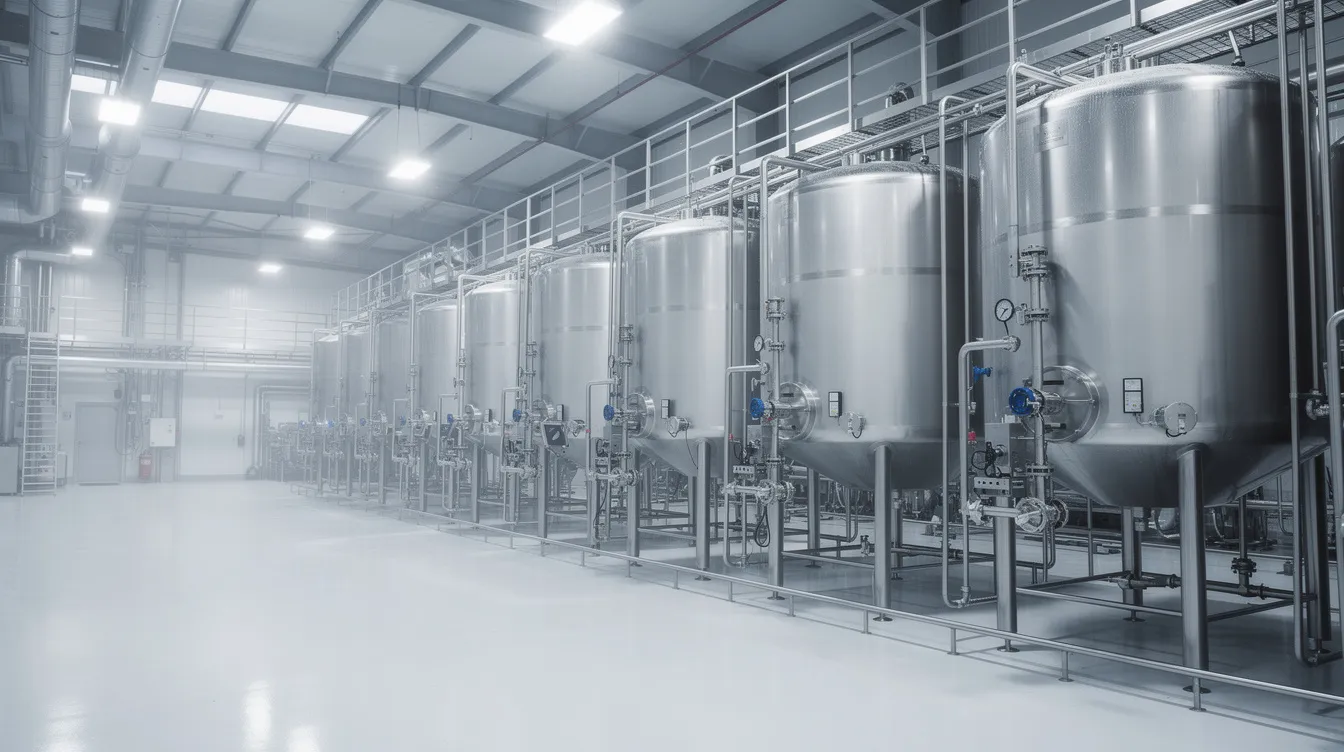
The principal drivers of dairy processing plant profitability include raw milk procurement economics, product mix and yields, installed capacity vs actual utilisation, selling price by channel, fixed vs variable cost structure, cold chain cost and financing cost. Focusing on high-margin value-added products significantly increases returns per litre of milk, but each driver must be evaluated together.
Dairy plant revenue and profitability should always be analysed in terms of contribution per litre of milk, not only percentage net profit on sales. While dairy farming, milk production and farm management matter upstream, this analysis focuses firmly on processing plant economics.
Milk Procurement Cost and Its Impact on Margins
Raw milk procurement cost usually contributes 60% to 80% of total variable costs in a typical Indian value-added dairy processing unit. Milk is typically the single largest operational expense in dairy processing.
- Procurement price per litre depends on fat and SNF content. Industry data shows flush season prices of ₹28–35 per litre rising to ₹38–48 per litre in lean season for standard milk.
- Seasonal fluctuation between flush (winter) and lean (summer) can swing raw material cost by 20–40%, directly impacting dairy plant contribution margin.
- Chilling centre investment, bulk milk coolers, collection routes, vehicle diesel and quality testing are significant cost components. A 500-litre BMC alone consumes ₹30,000–₹40,000 per year in electricity.
- A ₹1 per litre increase in milk procurement on a 1,00,000 LPD plant operating 300 days reduces annual EBITDA by approximately ₹3 crore if selling price is unchanged (1,00,000 × 300 × ₹1 = ₹3 crore). This is illustrative but demonstrates the sensitivity.
- Quality-related rejections and SNF shortages can reduce usable milk solids by 1–2%, significantly eroding dairy products manufacturing profit margin at scale.
Feed costs rose faster than milk prices in the early 2020s globally, squeezing dairy farmers and pushing up procurement prices for processors. Many farmers are under margin pressure, and processors must account for this in their cost assumptions.
Product Mix and Contribution per Litre of Milk
Different products have very different yields, processing costs and market prices, making value added dairy plant profit margin highly product-mix sensitive. Value-added dairy products give enterprises access to multiple market segments, and revenue diversification reduces risk from commodity milk price swings.
- Plan around contribution per litre of milk (₹ per litre after variable cost) for each product, not just high demand dairy products labels.
- Paneer uses 5–6 litres of buffalo milk per kg but delivers higher contribution per litre. Processing milk into cheese increases profit margins by 0.688 euros per litre compared to selling liquid milk, demonstrating the financial logic of value addition.
- Mass-market dahi has lower contribution per kg but much higher volume and turnover, with EBITDA margins of 10–12% for packaged curd.
- Paneer and curd markets are projected to grow at 19.86% and 6.2% CAGR respectively, indicating strong demand.
- Private label vs own brand and institutional vs retail product mix influence average realisation and marketing cost in the dairy processing business profitability model.
A detailed capacity planning and product mix strategy for value-added dairy plants is essential for accurate financial modelling.
Capacity Utilisation and Operating Leverage
Industrial dairy plants in India often install 50,000–1,00,000 LPD milk processing capacity but take 2–3 years to reach stable utilisation of 70–80%. Dairy farmers may not profit in the first five years of a new venture, and processing plants face a similar ramp-up challenge.
- Depreciation, key salaries, minimum utilities and interest form fixed costs that do not fall proportionately when volumes are low, causing low or negative dairy manufacturing business profit at 30–40% utilisation. Processing plants have high fixed costs tied to specialised machinery.
- Operating at full design capacity reduces the fixed cost per unit produced. As capacity utilisation increases from 40% to 70%, contribution grows faster than fixed costs, improving net profit and DSCR. Economies of scale can improve unit economics in larger dairy processing plants.
- A realistic DPR should assume phased utilisation: Year 1 at 40–50%, Year 2 at 60–70%, Year 3 onwards at 75–85%.
- Lenders closely review dairy plant capacity utilization and profitability assumptions when assessing bankability.
Selling Price, Market Positioning and Trade Margins
Ex-factory realisation after distributor and retailer margins, schemes and GST impact is what matters for dairy plant profitability analysis, not MRP printed on the pack. Branding allows for differentiated pricing and customer loyalty in dairy products. Local branding can enhance consumer trust and product appeal.
- B2B institutional sales offer lower prices but lower marketing cost, quicker payment and stable volumes.
- B2C branded retail achieves higher prices but requires higher distribution and marketing expense.
- Typical trade margins for chilled dairy in India: 5–10% distributor, 15–25% retailer (illustrative).
- Premium branded products like Greek yogurt and probiotic drinks support higher realisations but require modern retail presence, sampling and advertising budgets. Brand differentiation can command price premiums for dairy products. Capturing higher margins may require transitioning from bulk sales to branded products.
- Factor in product returns, expiry write-offs and schemes as separate line items. Higher margins can be achieved through premium pricing and a diversified product line.
Revenue Model of a Value Added Dairy Processing Plant
A professional DPR estimates revenue product-wise using: Installed capacity × capacity utilisation × yield × saleable quantity × net selling price. Processing dairy creates opportunities for greater control over branding and pricing.
- Estimate product-wise sales: daily milk allocation per product, conversion yield (kg per litre), pack sizes (200 g, 400 g, 1 kg) and annual operating days (typically 300–330 days).
- Illustrative example: If 10,000 LPD is allocated to paneer at 18% yield (buffalo milk), daily paneer production is approximately 1,800 kg. At ₹280/kg net realisation and 300 operating days, annual paneer revenue is approximately ₹15.12 crore. This is strictly illustrative.
- Avoid using a single average selling price. Build a detailed product-wise sales mix for accurate dairy processing plant ROI calculation.
A comprehensive revenue model and market strategy for value-added dairy products strengthens any financial projection.
Major Costs Affecting Dairy Plant Profit Margin
Understanding the split between variable, semi-variable and fixed costs is critical for dairy plant break even point and contribution analysis. Misclassification distorts break-even calculations.
Variable Costs in Value Added Dairy Production
Variable costs move broadly in line with litres processed or units sold and directly affect contribution margin.
- Raw milk cost per litre (fat/SNF-based pricing) – raw milk procurement cost comprises 60% to 80% of total variable costs
- Starter cultures, sugar, fruits, flavours, stabilisers and emulsifiers for yogurt and lassi
- Per-pack packaging material: cups, pouches, lids, cartons
- Variable energy: steam and electricity for pasteurisation, homogenisation, refrigeration. Dairy processing requires massive amounts of thermal and electrical energy.
- Per-trip distribution freight and sales commission
- For products like probiotic yogurt or flavoured lassi, packaging and ingredients can together account for 25–40% of ex-factory realisation
Quantify variable costs per litre of milk and per kg of product within the DPR to support precise contribution analysis.
Fixed and Semi-Fixed Costs in a Dairy Plant
Fixed and semi-fixed costs remain broadly stable in the short term even if production fluctuates, so they drive break-even volume.
- Management and technical staff salaries, security, housekeeping, administrative overheads
- Plant maintenance, lab and quality control expenses, insurance, factory rent
- Base refrigeration load, office utilities, IT/ERP costs
- Depreciation on plant, machinery, building and cold stores plus interest on term loans are large fixed charges affecting DSCR and dairy plant investment returns
- Distinguish between controllable overheads (discretionary marketing) and non-controllable charges (interest, statutory insurance) in the financial model
- Many promoters underestimate marketing and branding overheads in early years, reducing actual net profit vs projections
Machinery Investment and Its Effect on Dairy Processing Plant Profitability
Plant and machinery – pasteurisers, homogenisers, separators, fermenters, paneer presses, packaging machines, CIP systems, chillers and compressors – form a major portion of project cost and influence both yield and operating cost. Selecting the right equipment is a critical capital allocation decision.
- Lower-cost semi-automatic equipment requires more labour and produces higher wastage. Fully automated lines need higher investment but deliver better product consistency, energy efficiency and lower per-unit cost, improving long-term dairy processing plant ROI.
- Efficient CIP systems, heat recovery and modern fillers reduce cleaning losses, product spillage and utility consumption. Implementing heat recovery systems impacts energy efficiency positively and can save significant amounts annually.
- Overspecifying machinery capacity raises depreciation burden. Underspecifying leads to bottlenecks and underutilisation of other assets.
Detailed machinery and equipment cost planning for value-added dairy plants should be part of every serious DPR.
Manufacturing Process, Yield and Product Losses
Even a 1% improvement in overall product yield can add significant annual profit for a plant processing tens of thousands of litres per day. Adhering to food safety standards prevents recalls and legal liabilities in dairy processing. Monetizing byproducts like whey can create additional revenue streams.
- Key process steps: milk standardisation, pasteurisation, homogenisation, fermentation for curd and yogurt, coagulation and pressing for paneer, concentration for Greek yogurt, batching for lassi and probiotic drinks
- Typical loss points: cream separation, whey loss, fines in paneer whey, fermentation failures, spillage during filling, underweight/overweight packs, start-up and shutdown losses, returns due to quality issues
- Quantify expected recovery norms in the DPR and monitor actual performance against them
A well-designed manufacturing process and production line directly protects dairy plant profitability analysis in real operations.
Land, Building and Utilities: Cost Impact on Dairy Plant Financials
Land, building, utilities and hygienic layout together influence both CAPEX and OPEX, affecting project IRR and payback. Milk processing requires compliance with health and safety regulations, which adds to both capital and recurring costs.
- Land location (industrial area vs rural), built-up area for processing, cold rooms, dry store, utilities block, admin office and ETP are all reflected in the project cost and depreciation schedule.
- Utilities – steam boiler, water supply, RO plant, refrigeration system, air compressors, ETP, laboratory – consume power, water and maintenance expenses that must be captured correctly. Regulations significantly impact dairy processing business planning.
- A hygienic process flow layout (milk reception → processing → packaging → cold storage → dispatch) improves compliance and reduces cross-contamination risks.
The land, building, utilities and hygienic layout planning guide covers these aspects in detail.
Cold Storage and Cold Chain Cost in Value Added Dairy Plants
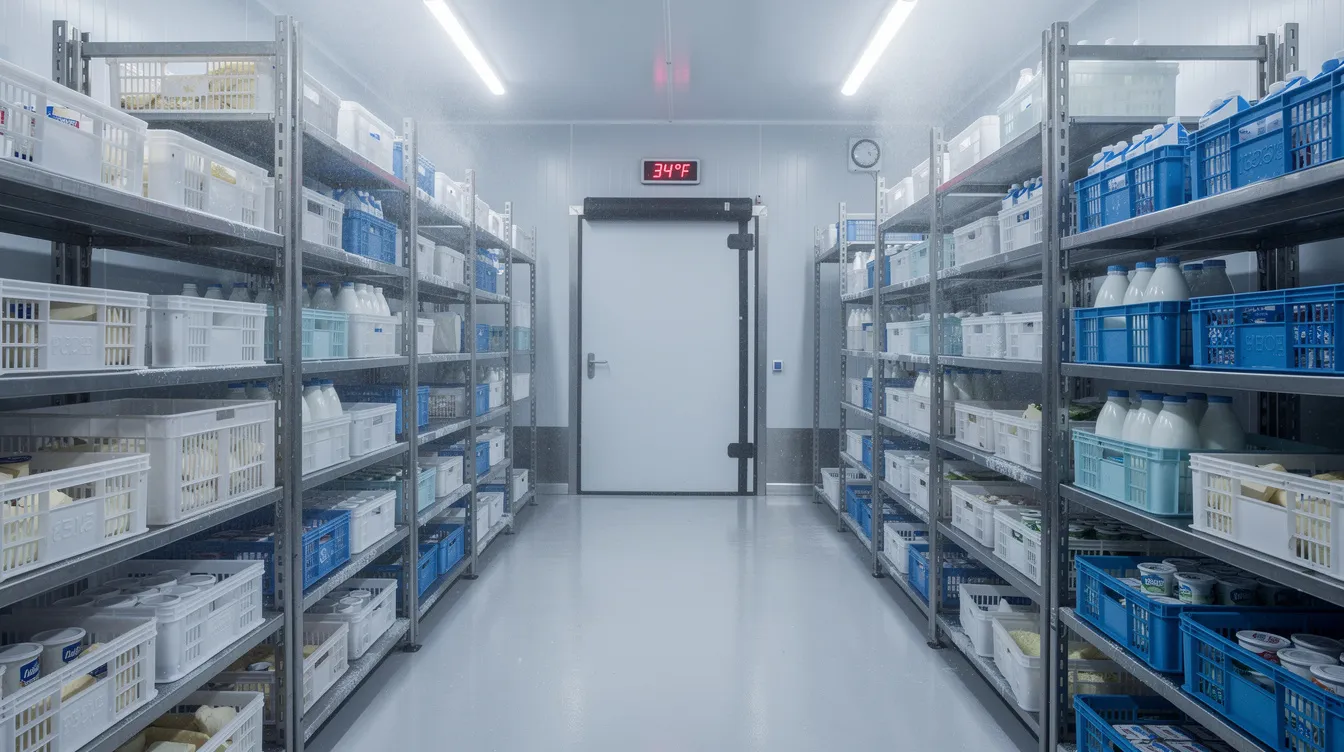
Most value added products – paneer, curd, yogurt, Greek yogurt, lassi, probiotics – are perishable and require continuous refrigeration from plant to retailer. Flawless cold chain management is crucial to minimizing product spoilage. Processing extends raw milk’s shelf life from days to weeks or months depending on the product, and extending shelf life safely broadens geographic reach.
- Plant-level cold rooms, walk-in chillers and blast chillers contribute to fixed and semi-variable costs. A 50 m³ cold room at 0–5°C costs approximately ₹8–12 lakh in CAPEX alone.
- Logistics costs include insulated or reefer vehicles, ice boxes, distributor cold rooms and retail refrigeration.
- Shelf life of 7–30 days means higher returns from distant markets and financial losses from temperature abuse leading to spoilage.
Detailed cold storage and cold chain requirements for value-added dairy distribution should be incorporated into every profitability calculation.
Project Cost, Financing Structure and Dairy Plant Investment Returns
Even if operating EBITDA margins look attractive, high CAPEX and debt can limit project feasibility. Both profitability and financing structure must be reviewed together. NABARD offers 25% to 33.33% capital subsidies for dairy projects, and the PMFME scheme provides grants up to ₹10 lakhs for micro food processors – these can improve project economics but should not be the sole basis for investment.
- Typical project cost components for a 50,000–1,00,000 LPD unit: land, site development, building, plant and machinery, utilities, cold storage, vehicles, pre-operative expenses, contingencies and margin for working capital. DPR benchmarks suggest CAPEX ranging from ₹5.8 crore to over ₹100 crore depending on scale and product basket.
- Means of finance usually include promoter equity (25–35% of project cost), unsecured loans, term loan from bank and sometimes government subsidies or financial assistance. Different debt-equity mixes affect interest burden and DSCR.
- Repayment schedule, moratorium and interest rate assumptions directly influence annual cash flow and ROI, IRR and payback period. Payback periods in recent DPRs range from 3.7 to 5.3 years under base-case assumptions.
A detailed project cost and means of finance analysis for value-added dairy plants is a critical component of any bankable proposal.
Calculating Contribution Margin in a Dairy Plant
Contribution = Sales Revenue – Variable Costs. Contribution margin percentage = (Contribution ÷ Sales) × 100.
Illustrative example (1 kg branded paneer):
| Item | ₹ per kg |
|---|---|
| Net selling price (ex-factory) | 280 |
| Raw milk cost (5.5 L × ₹38/L) | 209 |
| Packaging | 12 |
| Other ingredients & consumables | 5 |
| Variable freight & commission | 14 |
| Total variable cost | 240 |
| Contribution | 40 |
| Contribution margin % | 14.3% |
This example is strictly illustrative. Actual margins vary by city, milk cost and competition.
Product-wise contribution data helps management decide milk allocation across paneer, dahi, yogurt, Greek yogurt and lassi to maximise overall dairy plant profit margin. Contribution is also the base for calculating P/V ratio and dairy plant break even point, which lenders closely examine.
How to Calculate Dairy Plant Break-Even Point
Break-even is the level of sales at which total contribution equals total fixed costs and the plant neither makes profit nor loss.
Formulas:
- P/V Ratio = (Contribution ÷ Sales) × 100
- Break-Even Sales = Fixed Costs ÷ P/V Ratio
Step-by-step illustration (hypothetical annual figures):
| Parameter | ₹ Crore |
|---|---|
| Annual Sales | 50.00 |
| Variable Costs | 35.00 |
| Contribution | 15.00 |
| Fixed Costs (incl. depreciation, interest) | 10.00 |
- P/V Ratio = 15 ÷ 50 × 100 = 30%
- Break-Even Sales = 10 ÷ 0.30 = ₹33.33 crore
- If annual capacity allows ₹50 crore sales at 70% utilisation, break-even capacity utilisation ≈ 33.33 ÷ 50 × 70% ≈ 46.7%
These are not recommended targets – they only demonstrate method. A real DPR must avoid assuming uniform margins across all dairy products.
Break-Even Capacity Utilisation and Margin of Safety
Linking break-even sales to installed capacity gives break-even capacity utilisation percentage. If installed capacity equates to potential annual sales of ₹80 crore at 100% utilisation and break-even sales are ₹48 crore, then break-even capacity utilisation is 48 ÷ 80 × 100 = 60%.
Margin of Safety = Actual or Projected Sales – Break-Even Sales. Margin of Safety % = Margin of Safety ÷ Actual Sales × 100.
If projected sales are ₹56 crore and break-even is ₹48 crore, margin of safety is ₹8 crore or about 14.3%. A higher margin of safety offers resilience against milk price increases, demand dips or temporary operational issues. Both bankers and investors look for a reasonable margin of safety in dairy plant project report profitability before approving long-term funding.
Illustrative Profitability Model for an Industrial Value Added Dairy Plant
The following table presents a hypothetical P&L for a 50,000 LPD value-added dairy plant at 70% utilisation. All figures are illustrative.
| Parameter | Value |
|---|---|
| Installed milk processing capacity | 50,000 LPD |
| Capacity utilisation | 70% |
| Annual operating days | 300 |
| Annual milk processed | 1.05 crore litres |
| Gross sales | ₹48.00 crore |
| Raw material cost (milk + ingredients) | ₹28.80 crore |
| Packaging & consumables | ₹4.80 crore |
| Power & utilities | ₹2.40 crore |
| Employee cost | ₹2.20 crore |
| Other operating expenses | ₹1.80 crore |
| EBITDA | ₹8.00 crore |
| Depreciation | ₹2.50 crore |
| Interest on term loan | ₹2.00 crore |
| Profit Before Tax | ₹3.50 crore |
| Approx. break-even sales | ₹30.00 crore |
| Approx. break-even capacity | ~44% |
EBITDA margin is approximately 16.7%, while PBT margin is about 7.3%. DSCR in this scenario would likely be above 1.5x, which banks generally find acceptable. These figures are for understanding methodology only.
EBITDA Margin vs Net Profit Margin in Dairy Processing
EBITDA excludes depreciation and interest, measuring operating performance. Net profit includes both and reflects the impact of capital structure and tax. Cash accrual (PAT + depreciation) measures the project’s ability to service term loans and working capital limits.
- A dairy plant may show healthy EBITDA margin of 15–18% but have thin or negative net profit if machinery investment is high and term loan interest plus depreciation are large.
- Industry-wide net profit margins in Indian dairy rose from about 1.0% in FY23 to approximately 1.7% in FY24, per recent sector analysis, though value-added product players performed better.
- Distinguish accounting profit from cash flow clearly. Cash accrual is what banks evaluate via DSCR.
Working Capital Requirements and Their Impact on Profitability
Dairy plant working capital covers raw milk purchases, packaging inventory, ingredients, finished goods in cold storage, trade receivables and day-to-day expenses.
- Daily milk procurement payments vs weekly or fortnightly distributor payments create a timing mismatch. Institutional clients may take 30–45 days credit.
- Interest on working capital limits and delays in debtor collection can materially reduce dairy manufacturing business profit even when the P&L looks strong on paper.
- Rapid sales growth increases working capital needs faster than profit generation, so promoters must plan margin money in the DPR.
- CMA Data and projected balance sheets should reflect realistic stock and debtor levels for a bankable proposal.
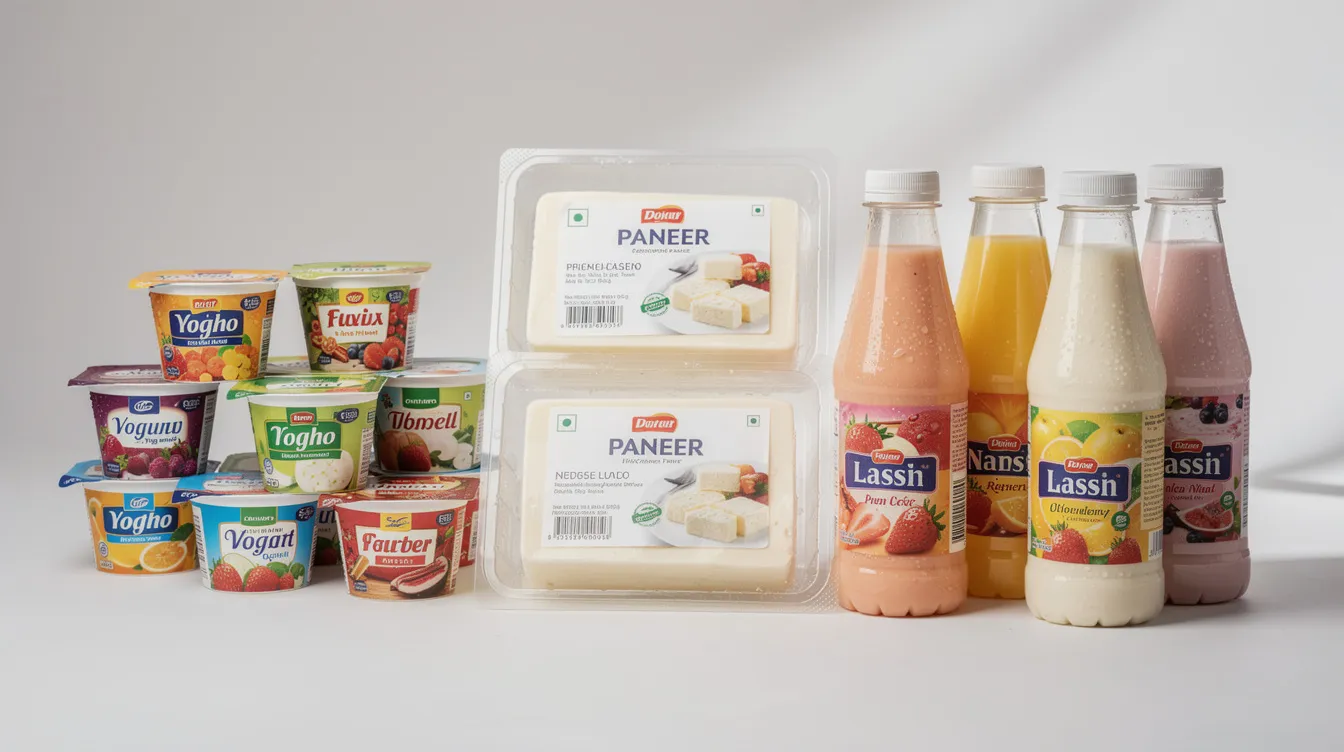
Product-Wise Profitability Analysis: Paneer, Curd, Yogurt, Greek Yogurt, Lassi & Probiotics
Each major value-added product should have its own mini-contribution and profitability analysis within the DPR. Using a single average margin assumption is a common error that misleads both promoters and lenders. Value-added dairy products can increase farm income and market visibility when positioned correctly.
Globally, the power of value-added dairy is demonstrated by case studies like Abe Farm in Japan, whose ASO MILK brand commands higher prices than competitors. Abe Farm’s annual sales grew from 1.71 million to 5.33 million dollars by 2021 through focused value addition. Notably, only 2.5% of Japanese dairy farmers have herds over 200 cows, yet smaller farms can thrive through processing and branding. Farmers can receive expert advice under Japan’s Sixth Industry policy to support such transitions. Even internationally, Massachusetts offers workshops on financing and grant sources for dairy processors, and the Serbian Ministry of Agriculture supports dairy processing investments.
Paneer
Paneer is one of the most profitable value added dairy products in many Indian markets due to strong institutional demand from hotels, restaurants, sweet shops and catering businesses.
- High milk solids utilisation, relatively short shelf life, need for reliable cold chain, and generally healthy contribution per kg when procurement is efficient
- Institutional B2B paneer has lower packing cost but lower price; retail branded paneer has higher MRP but also higher packaging and distribution outgo
- The Industrial Paneer Manufacturing Plant Project Report provides detailed financial modelling guidance
- Actual paneer margins vary widely by city, milk cost and competition
Curd / Dahi
Dahi is a high-volume, mass-market dairy product with strong daily consumer demand across India. Changing consumer preferences are driving growth in packaged dahi over loose curd.
- Modest contribution per kg but rapid turnover, sensitivity to packaging costs (cups vs pouches) and need for strong cold chain
- Price competition from co-operatives and large brands may limit premium pricing, impacting profit margins for smaller players
- Accurate demand forecasting and route planning minimise returns. The Curd / Dahi Manufacturing Plant Project Report covers dahi-specific financial considerations.
Industrial Yogurt
Flavoured yogurt and set yogurt cater to both branded retail and institutional segments (QSR chains, bakeries, hotels), allowing for differentiated pricing. Rising consumption in urban India supports growth.
- Incremental costs include cultures, flavours, fruit preps, higher packaging and frequent promotions in modern trade
- Per-kg realisation is higher than plain dahi, but the plant must invest in product development and marketing. The Industrial Yogurt Manufacturing Plant Project Report details these economics.
- Proper process control reduces batch failures that otherwise erode contribution quickly
Greek Yogurt
Greek yogurt is a premium, concentrated product with higher protein content, supporting higher MRPs in metros. Abe Farm’s drinkable yogurt achieved a PREMIUM of 4.45 in processing and a PREMIUM of 5.49 in retail, demonstrating how concentrated and branded dairy products can capture significant value.
- Lower yield: more milk required per kg due to whey removal. Expensive multi-layer packaging and niche demand require careful volume planning.
- Overall dairy plant revenue and profitability from Greek yogurt depends on brand strength and shelf space. The Greek Yogurt Manufacturing Plant Project Report explores this segment.
- Best introduced as part of a diversified product basket rather than stand-alone focus in early years. The dairy based beverages and gut health segment is growing but still limited to urban centres.
Lassi
Lassi is a high-volume, often seasonal dairy beverage with strong demand in summer months and in North and Central India. Sales volume peaks can be substantial but require planning.
- Uses curd and water plus sugar and flavours, giving reasonable contribution per litre but requiring robust cold chain
- 200 ml and 250 ml SKUs target price-sensitive consumers, so packaging and freight costs per unit must be tightly controlled
- Institutional supplies to airlines, railways and QSR can stabilise throughput. The Industrial Lassi Manufacturing Plant Project Report covers lassi-specific economics.
Probiotic Dairy Products
Probiotics are premium functional dairy products requiring specific strains, strict process control and robust cold chain. Rising demand for gut health products supports this category.
- Additional costs: specialised cultures, advanced quality control, branding and educational marketing
- Contribution per unit can be high but volume may be limited to urban, health-conscious segments
- Regulatory and labelling considerations for probiotic claims add compliance and R&D costs. The Probiotic Dairy Products Manufacturing Plant Project Report provides detailed feasibility guidance.
Impact of Product Mix on Overall Dairy Plant Profitability
The same installed milk capacity can generate very different profits depending on product allocation. Consider two illustrative scenarios:
- Plant A: 70% low-margin dahi, 30% paneer → stable volume but lower blended contribution per litre
- Plant B: 40% dahi, 30% paneer, 20% yogurt/lassi, 10% Greek/probiotic → higher blended margin but more complexity, marketing spend and working capital
Constraints to pushing only high-margin products include limited market demand, shorter shelf life, higher marketing spend, production bottlenecks and higher working capital. DPRs should include sensitivity analysis for different product-mix combinations. Any mix change also impacts equipment utilisation, so plant layout and machinery sizing must be coherent with targeted mix. Value-added dairy products can increase farm visibility and market share when the mix is well-calibrated. A 22% decline in Spanish dairy farms from 2018 to 2022 illustrates how failing to adapt product strategy can erode viability even in established dairy markets.
Sensitivity Analysis of Dairy Plant Profitability
Testing how changes in key assumptions affect dairy processing plant ROI and DSCR is essential. In early 2026, milk procurement prices increased by ₹3–4 per litre, compressing margins across Indian dairy processors.
| Sensitivity Factor | Change Tested | Illustrative Impact on Annual PBT |
|---|---|---|
| Raw milk price | +₹2/litre | Reduction of ~₹2.1 crore |
| Average selling price | –5% | Reduction of ~₹2.4 crore |
| Capacity utilisation | –10% (70% → 60%) | Reduction of ~₹1.5 crore |
| Packaging cost | +15% | Reduction of ~₹0.7 crore |
| Term loan interest rate | +2% (9% → 11%) | Reduction of ~₹0.5 crore |
(Figures illustrative for a 50,000 LPD plant; actual impact depends on project specifics.)
Well-prepared DPRs presented to banks always include sensitivity analysis, helping lenders judge robustness and cost efficiency of the project.
Profitability Analysis in a Bankable Dairy Plant DPR
Bankers expect logical assumptions, coherent numbers and clear presentation of profitability and risk in a dairy plant DPR financial analysis.
- Required financial components: capacity and product mix assumptions, detailed production schedule, product-wise sales and pricing, operating cost estimates, full project cost, means of finance, term loan amortisation, working capital assessment
- Projected P&L accounts, balance sheets and cash-flow statements for at least 7–10 years, plus DSCR, ROI, IRR, payback period and break-even analysis
- Internal consistency between DPR projections, CMA Data submitted to banks and loan proposals is critical. Inconsistencies raise red flags during appraisal.
- Independent sensitivity analysis, scenario planning (optimistic, base, conservative) and clear commentary on assumptions significantly improve credibility
Common Mistakes in Dairy Plant Profitability Projections
Many value-added dairy proposals fail to secure bank loans or struggle operationally because of technically weak projections.
- Assuming near-100% capacity utilisation from first year
- Ignoring seasonal variation in milk supply and milk prices
- Using unrealistic selling prices not aligned with local competition
- Underestimating distributor and retailer margins
- Ignoring product losses, expiry returns and food safety compliance costs
- Underestimating packaging, cold storage and power/refrigeration expenses
- Assuming identical profit margins for every dairy product
- Omitting working capital interest in profitability calculations
- Confusing EBITDA with cash available for debt servicing, which leads to overestimation of loan repayment capacity
Promoters should validate every major assumption with data from suppliers, distributors, competitor benchmarking and, where possible, small pilot sales before finalising their dairy processing DPR.
Strategies to Improve Value Added Dairy Plant Profitability
These are financially meaningful strategies, not generic advice:
- Improve milk procurement efficiency through direct farmer networks, quality-based pricing and bulk milk cooler investments to reduce cost per litre
- Increase yield through process optimisation, staff training and reducing processing and packaging losses
- Optimise capacity utilisation via B2B contracts and institutional supply agreements
- Optimise product mix towards higher-contribution SKUs without overexposing the plant to demand risk
- Reduce energy consumption through efficient chillers, boilers and heat recovery systems
- Improve pack-size selection and introduce premium variants for urban markets
- Strengthen distributor incentives tied to volume and freshness to reduce returns
- Maintain disciplined working capital control, timely price revisions when milk prices change, and regular variance analysis against DPR projections
Role of CA Manish Gugliya in Dairy Plant Financial Planning
As CA Manish Gugliya, my focus is on preparing realistic, data-backed financial models for value-added dairy plants rather than offering generic templates.
- Preparation of Detailed Project Reports (DPR) for dairy processing units, bank finance DPRs and CMA Data for working capital and term loans
- Dairy plant financial feasibility analysis including profitability projections, break-even analysis, contribution studies, DSCR calculation, ROI and IRR estimation, and sensitivity analysis tailored to specific plant sizes and locations
- Structuring means of finance, assessing working capital limits and aligning projections with lender expectations – but not “certifying” future profits or guaranteeing loan sanctions
- ProjectReportBank.com serves as a resource hub for sector-specific project reports and customised financial modelling support for value-added dairy and food processing projects
Conclusion: Making Informed Decisions on Value Added Dairy Plant Profitability
Value added dairy plant profitability depends on multiple interconnected factors: product-wise contribution, capacity utilisation, milk procurement cost, processing yield, packaging, cold chain, fixed overheads, working capital and financing structure. The Indian dairy industry is a growth industry with the dairy industry in India expected to grow at a CAGR of 11.73%, but rising demand alone does not ensure project-level profitability.
Break-even analysis, margin of safety, sensitivity analysis and DSCR evaluation are essential before committing significant capital. A carefully prepared, bankable DPR helps promoters, investors and lenders understand whether the proposed dairy business can generate sustainable returns and service its financial obligations over the long term.
Entrepreneurs considering such projects should seek expert financial guidance and robust project reports rather than relying on generic profit-per-litre rules of thumb. The difference between a successful dairy processing venture and a struggling one often lies not in the production technology but in the quality of financial planning behind it.
FAQs on Value Added Dairy Plant Profitability and Break-Even Analysis
The following questions address practical concerns frequently raised by Indian dairy entrepreneurs and investors planning a dairy processing plant.
What is a realistic payback period for an industrial value added dairy plant in India?
Depending on scale, product mix, utilisation ramp-up and financing structure, many bankable projects target equity payback in about 5–8 years. Recent DPR benchmarks show payback periods of 3.7–5.3 years under favourable assumptions. High-CAPEX plants with heavy cold chain and branding investment may have longer payback and must be evaluated cautiously with sensitivity scenarios. Economic behavior of milk prices and consumer demand should be stress-tested over the projection period.
How much own capital (equity) should a promoter plan for a 50,000 LPD value added dairy plant?
Indian banks commonly expect promoter contribution of at least 25–35% of total project cost including margin for working capital. Adequate equity improves DSCR and provides resilience during the initial low-profit years while capacity utilisation is ramping up. Under-capitalised projects carry higher economic impact risk if milk prices spike or demand is slower than projected.
Can a value added dairy plant be profitable if most sales are B2B and private label rather than own brand?
B2B and private label models generally earn lower selling prices but may have lower marketing and distribution costs, more stable volumes and faster collections. This can still support attractive EBITDA and cash profits if procurement and processing are efficient. A proper dairy plant profitability analysis must separately model B2B and B2C channels, including trade margins, credit terms and expected returns. Finished products sold under private label reduce branding cost but limit long-term pricing power.
How do government subsidies affect the financial feasibility of a dairy processing project?
Capital subsidies (such as NABARD’s 25% to 33.33% for dairy projects) and interest subventions under schemes like NPDD and DIDF can improve project IRR and reduce effective payback period. However, promoters should always evaluate project viability even without subsidy, as disbursement is conditional and time-bound. Banks typically appraise projects on underlying strength first and treat subsidy as an additional comfort.
Is it necessary to prepare CMA Data separately if I already have a DPR for my dairy plant?
Yes. CMA Data in prescribed banking format is usually required for working capital and term loan appraisal. While it is based on the same projections as the DPR, it presents information in a lender-specific structure covering current assets, current liabilities, projected profitability and fund flow. Ensuring consistency between DPR figures and CMA Data helps avoid queries and delays during bank appraisal for a value-added dairy processing project. High quality dairy products and sound financial documentation together make a project bankable.