
Key Takeaways
- A value-added dairy products revenue model is fundamentally different from a liquid milk business-profitability depends on product mix, net realisation per kg, capacity utilisation, distribution margin and working capital cycle, not just litres processed.
- The dairy plant revenue model for an industrial-scale facility must account for product-wise yield, channel-specific trade margins, cold-chain costs and realistic ramp-up timelines rather than assuming full capacity and MRP-level pricing from day one.
- Investors and bankers evaluate dairy projects on realistic dairy plant revenue streams, contribution margin by product, projected cash flow and DSCR-not inflated top-line numbers disconnected from market absorption.
- A balanced value-added dairy business model combining retail, institutional, HoReCa, B2B and premium segments generally produces more stable revenue and lower concentration risk than dependence on a single channel.
- Before committing substantial capital to a value-added dairy processing plant in India, promoters should invest in a customised DPR and financial feasibility assessment prepared by an experienced professional such as CA Manish Gugliya.
Introduction: Why Value-Added Dairy Economics Differ from Liquid Milk
In my practice as a Chartered Accountant advising dairy project promoters, one of the most common misconceptions I encounter is treating a value-added dairy plant like a scaled-up version of selling milk. It is not. Traditional dairy sales depend on high-volume, low-margin commodities like raw milk, where revenue is a simple function of litres sold. A value-added dairy processing plant, by contrast, monetises multiple value streams-fat, SNF, protein, fermentation, packaging and brand-from the same litre of milk.
India produces approximately 400 million litres of milk daily, yet over 80% of milk consumption remains as liquid milk and roughly 48% of the country’s milk is retained by producers for personal use. Over 170 million litres of surplus milk flows through unorganised channels. This creates a massive commercial opportunity for organised dairy processing. The Indian milk economy is worth approximately ₹5 lakh crore and India’s dairy market is projected to grow at 15–16% CAGR, with value-added dairy products being the fastest-growing segment in dairy. Investments worth ₹15,000 crore are expected in India’s milk business, and private equity players have recently invested around ₹900 crore in the dairy sector.
These numbers explain why a well-constructed dairy products market strategy matters now more than ever. But the commercial drivers of a value-added dairy products revenue model are radically different from commodity milk: milk solids recovery, product yield, shelf life, cold-chain cost, distribution margin, retail trade schemes and expected product returns all determine whether the project generates cash or burns it. Small errors in assumptions about product mix, average net realisation, capacity utilisation or wastage can materially affect the bankability of a dairy project. The sections below walk through the revenue architecture, channel economics, pricing mechanics and risk mitigation that any serious promoter must understand before committing capital.
Understanding the Value-Added Dairy Products Revenue Model
At its simplest, the dairy processing plant revenue model starts with one equation:
Annual Revenue ≈ Installed Capacity × Operating Days × Capacity Utilisation × Product Yield × Net Realisation per kg or litre
Each variable in that equation must be estimated product-wise, not averaged blindly across the entire plant. A litre of milk converted into paneer, curd and whey generates a completely different revenue profile than the same litre sold as pasteurised pouch milk.
Consider the distinction between these terms:
- Installed capacity is the technical maximum throughput (e.g., 1 lakh litres per day of milk processing).
- Processing capacity is effective throughput after accounting for CIP cleaning, changeovers and downtime.
- Saleable output is finished product available for dispatch after rejecting defective batches, process loss and rework.
- Capacity utilisation is actual production as a percentage of installed capacity over a period.
- Net sales is revenue after subtracting trade discounts, distributor/retailer margins, promotional schemes and product returns.
Value-added dairy models require higher upfront investment in processing capabilities compared to a simple milk chilling or pasteurisation setup. Milk production in small farms is often financially unfeasible without value addition, and even small dairy farms can improve profitability significantly through value-added processing.
New plants in India typically ramp up gradually: 40–60% utilisation in year one, 60–75% in year two, and 70–85% by year three. Assuming 80–90% utilisation and full-price realisation from year one can make a DPR look superficially attractive, but experienced bankers will discount those projections immediately. A realistic ramp-up narrative-backed by distributor appointment timelines, cold-chain readiness and marketing budgets-is far more credible.
Major Revenue Streams in a Value-Added Dairy Plant
A robust dairy plant revenue model is built around multiple product lines, each with distinct margins, shelf lives and sales channels. The objective is not just diversification for its own sake but strategic allocation of milk solids-fat, SNF, protein-into the products that generate the highest net contribution per litre of raw milk procured.
The subsections below cover the major commercially scalable product families relevant to an industrial plant in India, with their channel suitability and revenue characteristics.
Paneer and Fresh Cheese
Paneer is among the most important high margin dairy products in India. The organised paneer market was estimated at approximately ₹40.6 billion in FY 2025 and is projected to reach ₹102 billion by FY 2030, growing at roughly 20% CAGR.
Revenue drivers differ sharply between B2B and retail: restaurants, hotels, caterers and cloud kitchens buy 1–5 kg blocks at negotiated rates, while modern retail demands 200–500 g vacuum-packed SKUs at higher per-kg realisation. Product yield depends heavily on milk composition-approximately 5–6 litres of buffalo milk or 8–9 litres of cow milk are needed per kilogram of paneer.
Processing milk into cheese increases profit margins significantly; cheese production yields higher profit margins than raw milk. Even a mid-scale project can demonstrate strong economics-for instance, Abe Farm’s cheese processing project showed a strategic net present value of €142,518. For promoters considering a paneer-led plant, the Industrial Paneer Manufacturing Plant Project Report provides deeper technical-capacity and financial insights.
Curd / Dahi
Curd is a high-volume, fast-moving staple with a short shelf life, forming a core part of the value-added milk products business across most Indian regions. Revenue streams span family tubs (400 g to 1 kg), single-serve cups (100–200 g) and institutional bulk packs (5–25 kg).
CRISIL data indicates operating margins for packaged curd at approximately 10–12%, considerably better than processed fluid milk at 4–6%. The shift towards value addition is evident across the dairy sector-for instance, only 18% of Prabhat Dairy’s revenue comes from fresh milk, with the balance driven by value added products.
Regional preferences-set curd versus stirred curd, sweet versus sour profiles-directly affect product formulation and dairy products market strategy. Promoters should reference the Curd / Dahi Manufacturing Plant Project Report when designing production capacity and distribution radius.
Yogurt and Greek Yogurt
Yogurt and Greek yogurt occupy the premium dairy products market with higher price points and strong competition from national brands. Industrial yogurt-plain and flavoured-fits both retail and B2B segments including institutional catering, airlines and corporate cafeterias, typically with better shelf life than plain curd.
Greek yogurt is a high-margin product, priced higher than regular yogurt, due to its higher solids content and protein positioning. Abe Farm’s drinkable yogurt, for example, demonstrated a processing premium of 4.45 over base milk value. Consumers are willing to pay a premium for perceived improvements in dairy quality, and health conscious consumers increasingly drive demand in this category.
The impact on dairy product mix profitability must be modelled carefully in the DPR. For detailed planning, refer to the Industrial Yogurt Manufacturing Plant Project Report and the Greek Yogurt Manufacturing Plant Project Report.
Lassi and Fermented Dairy Beverages
Lassi, chaas and flavoured fermented beverages are seasonal yet scalable products with strong demand from April through September, and growing year-round acceptance in PET and carton formats. Convenience fuels demand for ready-to-eat and on-the-go dairy options, making single-serve packs (200–300 ml) increasingly popular in retail, modern trade and e-commerce.
Revenue dynamics vary: single-serve on-the-go packs command better per-litre realisation in retail, while larger SKUs serve HoReCa and institutional catering at lower margins but steady volumes. Cold-chain dependency and packaging format decisions directly affect route-to-market, freight cost per litre and effective dairy product sales strategy.
Promoters exploring large-scale lassi production should consult the Industrial Lassi Manufacturing Plant Project Report alongside this revenue analysis.
Probiotic Dairy Products
Probiotics represent a functional, health-oriented category requiring clear strain selection, stability validation, FSSAI regulatory compliance and strong branding to justify premium pricing. Consumers increasingly seek functional nutrition in dairy products, and rising health consciousness among urban populations is expanding the target market. Specialised nutrition also drives revenue in categories like lactose-free and organic dairy products.
Revenue model characteristics include lower volumes initially, higher R&D and marketing cost, but significantly better contribution margins when well executed. Demand for functional and innovative dairy products supports revenue growth in this segment. Modern trade, e-commerce and quick commerce channels in metros are the natural fit for a differentiated dairy products marketing strategy.
For technical and feasibility reference, promoters should connect this analysis with the Probiotic Dairy Products Manufacturing Plant Project Report.
Ghee, Butter and Milk Fat Products
Ghee and butter serve as critical fat-balancing products in a value-added plant, offering longer shelf life, wider geographic reach and potential for national or export sales. Dairy exports from India are increasing, especially for ghee and skimmed milk powder, creating opportunities beyond the domestic market.
Ghee acts as a strategic buffer when curd or yogurt demand fluctuates, helping stabilise dairy plant revenue streams across seasons. B2B demand from mithai manufacturers, bakeries and HoReCa is substantial, while retail-branded packs attract consumers seeking quality and traceability. CRISIL estimates operating margins for butter at approximately 8–10% and ghee at 6–8%, though capacity utilisation for these product categories tends to be lower-AmulFed’s butter plant operates at roughly 49% utilisation.
Other Value-Added Products: Cream, Flavoured Milk, Dairy Desserts
Fresh cream, whipping cream, flavoured milk, shrikhand, rabri, puddings and frozen desserts can serve as supplementary revenue streams that lift utilisation and brand visibility. Some of these, such as ultra high temperature processed flavoured milk, can extend the market radius beyond the chilled distribution network, supporting dairy products market expansion strategy. Artisanal and gourmet dairy variants appeal to modern sensory preferences, while packaging innovations enable longer shelf life and wider reach.
These items should typically be introduced in Phase 2 or 3 once core lines like paneer and dahi have stabilised. Careful SKU rationalisation is essential to avoid complexity and under-utilised product lines that dilute overall dairy business financial model performance.
Product Mix as the Foundation of the Revenue Model
Relying on a single hero product-say, only paneer-creates dangerous concentration risk in any value-added dairy products revenue model in India. If paneer demand softens seasonally or a competitor undercuts pricing, the entire plant’s economics suffer. The same litre of milk can be directed into curd, yogurt, paneer or ghee depending on fat/SNF balance, market demand and net contribution, and this allocation is a continuous management decision.
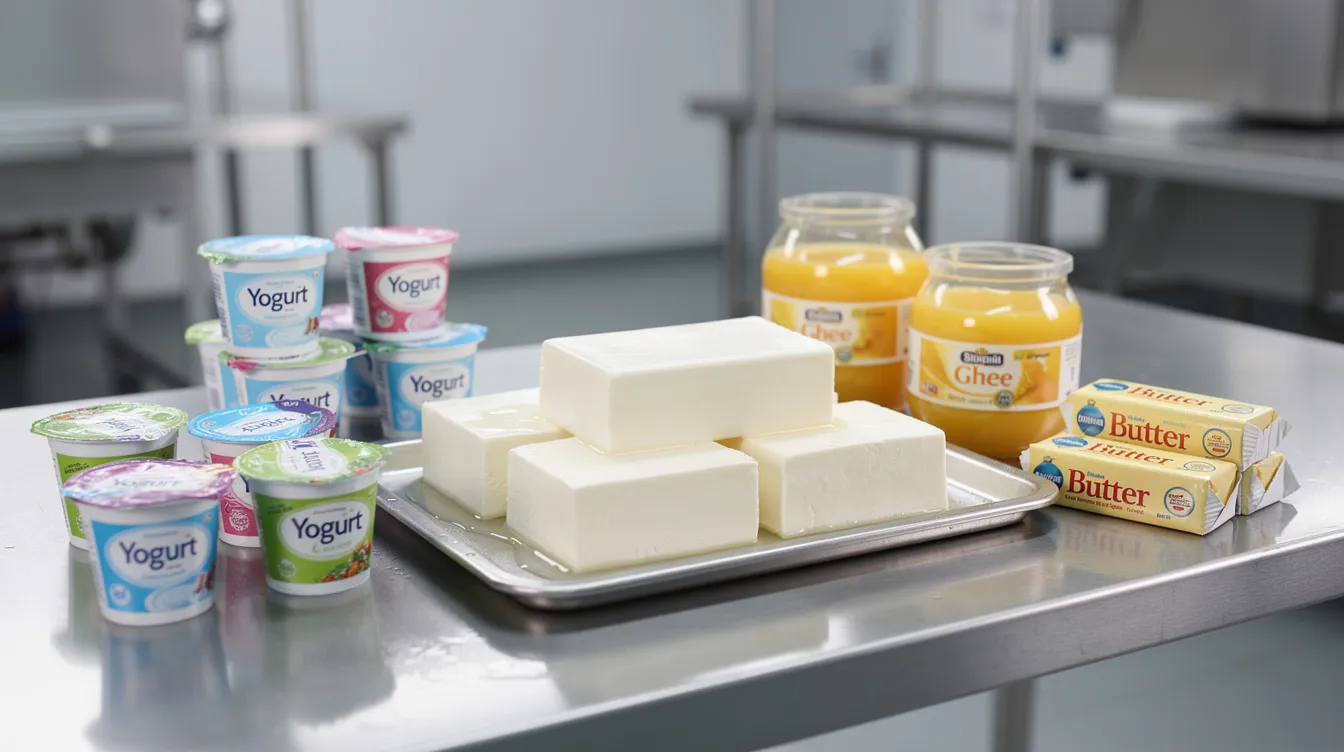
A sound dairy product portfolio strategy deliberately combines high-volume staples (curd, lassi) for base capacity utilisation, high-margin niche products (Greek yogurt, probiotic drinks) for margin uplift, long shelf-life fat products (ghee, butter) for geographic reach and revenue stabilisation, and B2B bulk items for volume predictability. The concept of product contribution margin-(Net Realisation – Variable Cost) per kg or litre-is the metric that must guide these allocation decisions, not just top-line revenue per product.
For promoters working through DPR design, aligning detailed capacity and mix decisions with the Value-Added Dairy Plant Capacity Planning & Product Mix resource is a practical starting point.
Revenue Model by Sales Channel
An Indian value-added dairy plant typically accesses revenue through multiple sales channels: distributor–retail, institutional, HoReCa, modern trade, D2C, e-commerce and B2B private label. Each channel has different realisation levels, risk profiles and credit terms. A balanced dairy products distribution strategy blends several channels, avoiding over-dependence on any single buyer type or geography.
Distributor and Retail Network
The classic Indian distribution chain-company → super stockist → distributor → retailer → consumer-underpins mass-market sales for dahi, lassi, yogurt and paneer. Distributor and retailer margins typically consume 15–25% of MRP depending on product category and region. Realistic margins must be built into the dairy plant revenue model from the outset.
Geographic expansion usually starts within a 150–200 km radius of the plant due to cold-chain constraints for chilled products, expanding to adjoining districts and states as infrastructure and procurement volumes grow.
Direct Institutional Sales
Supply to hospitals, colleges, hostels, corporate cafeterias and industrial canteens typically involves bulk packs at negotiated pricing. Margins per kg may be lower than retail, but stable off-take supports capacity utilisation and reduces marketing expenses. Commercial considerations include tenders, credit terms (often 30–45 days), quality audits and revenue concentration risk from dependence on a few large accounts.
HoReCa Market
Hotels, restaurants and caterers purchase paneer, cream, butter, curd and ghee in 1–20 kg formats. These buyers value consistency, predictable supply and credit terms; pricing often benchmarks against local competitors and cooperatives. Strong HoReCa penetration can form the backbone of early cash flow for a new plant while retail brand-building is still underway.
Modern Trade
Supermarkets and hypermarkets offer excellent visibility for premium yogurts, Greek yogurt, probiotic drinks and high-end paneer. However, the commercial realities-listing fees, planogram commitments, in-store promotions, higher returns and longer credit periods-must be factored into dairy products margin analysis. Retail expansion and e-commerce channels enhance the distribution of perishable dairy items, but promoters should phase their modern trade entry once supply chain reliability and base-level brand equity are established.
Direct-to-Consumer Sales
Own outlets, milk booths, kiosks and subscription-based home delivery in urban clusters capture higher realisation and direct consumer feedback. Operational demands include route planning, daily order management and brand control. D2C through direct marketing and direct sales works best as a complementary channel near the plant or in one–two focus cities, not as the sole pillar of the value-added dairy business model.
E-Commerce and Quick Commerce
Listing on grocery apps, marketplaces and 10–30 minute delivery platforms suits premium dairy and impulse products-flavoured milk, yogurt cups, single-serve lassi. Commission fees, marketing charges, logistics integration and returns erode net realisation below MRP. This channel works best for higher value-per-unit SKUs targeting urban consumers seeking convenience and functional nutrition.
B2B Private Label Manufacturing
Contract manufacturing and white-labelling for retailers, QSR chains or other brands can scale plant utilisation without heavy brand marketing investment. Pricing is negotiated on a cost-plus basis with lower margins but longer-tenor contracts that improve visibility of dairy plant revenue projection. Customer concentration risk and the need for robust quality systems and audits are key considerations.
Pricing Strategy for Value-Added Dairy Products
There are two broad approaches to dairy product pricing strategy: cost-plus pricing (adding a defined margin over fully loaded cost) and market-driven pricing (anchoring to competitor pricing and customer willingness-to-pay). In practice, most Indian dairy businesses use a blend-cost analysis sets the floor, while competitive benchmarking and brand positioning determine the ceiling.
Key cost components to capture include: raw milk (typically 70–80% of variable costs), milk fat and SNF value, processing loss, utilities, labour, packaging, freight, chilled storage, distributor and retailer margins, promotional schemes, applicable taxes and expected product returns. The MRP on the pack is not the company’s revenue. The realistic chain looks like this:
MRP → Less Retailer Margin → Less Distributor Margin → Less Trade Schemes/Discounts → Net Realisation to Manufacturer
Illustrative Example (200 g Paneer Pack):
| Component | Amount (₹) |
|---|---|
| MRP | 90.00 |
| Less: Retailer Margin (15%) | 13.50 |
| Less: Distributor Margin (8%) | 7.20 |
| Less: Schemes & Promotions (3%) | 2.70 |
| Net Realisation to Manufacturer | 66.60 |
These figures are purely illustrative and should not be treated as actual prices or guaranteed realisations. Actual numbers will vary by region, competition and brand strength.
Pricing must be reviewed continuously as raw milk prices, packaging costs and competitor actions change, rather than freezing the value-added dairy products revenue model for the entire projection period. Milky Mist, for example, saw its realisation per litre of milk procured increase from approximately ₹65.90 in FY 24 to ₹77.79 in FY 26, reflecting an improving premium product mix.
Gross Margin and Contribution Margin Analysis
Sales turnover alone does not determine profitability. Gross margin at the company level and contribution margin at the product or SKU level serve different analytical purposes in a dairy business financial model.
Two products with similar revenue can produce very different cash contribution. For instance, a large-volume dahi line generating ₹5 crore in annual sales at 10% contribution margin yields ₹50 lakh in cash contribution, while a smaller Greek yogurt line generating ₹2 crore at 22% contribution margin yields ₹44 lakh-nearly as much from less than half the revenue. Both have a role: the dahi line absorbs fixed costs through volume, while the Greek yogurt line lifts overall margin.
Fixed operating expenses-salaries, rent, depreciation, marketing overheads, administration-are absorbed by contribution from all products combined to arrive at EBITDA. CRISIL data indicates that EBITDA margins for specialty cheese can reach 16–18%, while processed fluid milk typically operates at just 4–6%. Promoters should insist on product-wise and channel-wise margin analysis when reviewing feasibility reports to avoid hidden cross-subsidies between profitable and unprofitable lines.
Market Segmentation Strategy for Value-Added Dairy Products
A structured dairy product market segmentation plan aligns product, price, pack size and channel with specific target segments rather than treating the Indian dairy market as one undifferentiated mass.
Geographic Segmentation
Start with city-level marketing within 50–100 km of the plant for fresh, short shelf-life products. Regional distribution across multiple districts follows as cold-chain infrastructure develops. State-level coverage, metro focus and eventual multi-state expansion are phased over 3–7 years. Kerala’s dairy market, for example, is expected to grow at a CAGR of 15.7% from 2021 to 2026, with approximately 70% of milk in Kerala sold to dairy cooperative societies-understanding such regional dynamics is essential before entering a new geography.
Customer-Type Segmentation
Distinct customer groups-end consumers (retail), distributors, institutional buyers, HoReCa, food processors, modern trade chains and e-commerce platforms-each require different messaging, pack formats and service levels. Smaller SKUs with brand stories work for retail consumers, while bulk packs with price-focused contracts suit institutional buyers. The dairy products B2B market, including food processors requiring whey protein or cream as ingredients, represents a distinct segment with its own economics.
Price Positioning Segmentation
Tiers range from economy (price-sensitive, local brands) through mass market (cooperatives and leading private brands) to premium (value-added, health-oriented, probiotic yogurt, high-protein variants) and specialised functional SKUs. Entering the mass market with commoditised milk products alone requires deep capital and brand investment; a carefully chosen premium niche strategy in the premium dairy products market can be more capital-efficient for a new entrant.
Brand-Led vs B2B-Led Dairy Business Model
Most successful dairy plants operate a hybrid of two approaches: consumer-brand-led retail focus and B2B/institutional focus. The blend shifts over time as the brand matures.
Brand-Led Retail Model
Building a consumer brand requires sustained investment in packaging design, advertising, in-store promotions, digital marketing and consumer engagement. Amul invests ₹800–1,000 crore annually in processing facilities and brand-building-a benchmark that illustrates the scale of commitment required for national brands. Brand strength influences consumer trust and pricing power in dairy goods, and the reward is stronger control over value-added dairy products pricing and profitability plus an intangible brand asset that commands higher business valuations. This route suits promoters with access to patient capital and willingness to build over 3–7 years.
B2B and Institutional Model
In this model, the plant manufactures under another brand’s label or supplies bulk to HoReCa and industry, reducing consumer advertising expenditure. The advantages are faster capacity utilisation, lower marketing cost per unit and a simpler SKU basket. The disadvantages include tight margins, customer concentration risk and limited brand equity creation. A blended strategy-where early years rely more on institutional volumes while a consumer brand develops steadily-often represents the best business model for new entrants.
Importance of Cold Chain in the Revenue Strategy
Improved cold chain infrastructure expands the market for fresh dairy products-this is not a theoretical point but a direct determinant of revenue potential. Cold storage and refrigerated transport define the effective radius and reliability of the dairy products distribution strategy in India. Key commercial factors include:
- Product shelf life at maintained temperatures (4°C for most chilled dairy)
- Expected returns and shrinkage from temperature excursions
- Stock rotation discipline at distributor and retailer levels
- Distributor viability when handling chilled SKUs with tight expiry windows
Stronger cold-chain capability allows promoters to add higher-value, short shelf-life products-yogurt, probiotic drinks, fresh cheese-to the value-added dairy product mix, directly enhancing margin. Promoters should review Cold Storage & Cold Chain Requirements for Value-Added Dairy Products as a companion resource when planning infrastructure.
Manufacturing Efficiency and Its Impact on Revenue
Technical efficiency translates directly into commercial outcomes. Better product yield, lower process loss and consistent quality increase saleable output and net revenue from the same quantity of raw milk procured. Key parameters include:
- Milk solids recovery and fat/SNF balance optimisation
- Batch consistency (texture, taste, microbial standards)
- Rework and reject levels
- Packaging losses and fill-weight accuracy
- Plant downtime for cleaning, maintenance and changeovers
Minimising variability reduces consumer complaints and return rates, improving net realisation and stabilising monthly revenue statements-a factor that banks monitor closely in dairy processing business profitability analysis. For detailed technical reference, the Value-Added Dairy Products Manufacturing Process & Production Line resource covers plant layout and SOPs comprehensively.
Capacity Utilisation and Revenue Ramp-Up
Most new industrial value-added dairy plants in India require a ramp-up across several stages:
- Trial production and quality stabilisation – initial months at low throughput
- Initial market entry – first distributor appointments, local institutional sales
- Distribution scaling – expansion to regional markets, trade scheme activation
- Brand stabilisation – consistent repeat orders, product acceptance in retail
- Mature utilisation – plant operating at 70–85% of installed capacity
AmulFed Dairy reports overall milk handling plant utilisation at approximately 74% annually, while its fermented product plants run at nearly 98%-illustrating that utilisation varies dramatically by product line. DPRs should reflect a realistic utilisation curve instead of assuming immediate full-load operation. An over-optimistic dairy plant revenue projection that shows 85% utilisation in year one may look impressive on paper but will not survive bank scrutiny.
Promoters should align ramp-up planning with Value-Added Dairy Plant Capacity Planning & Product Mix guidance to avoid under-sizing or over-sizing capacity relative to sales potential.
Plant Infrastructure and Market Expansion
The physical configuration of land, building, utilities, cold rooms and dispatch areas must be designed with future market expansion strategy in mind. Provision for a second production line, additional cold storage bays and expanded dispatch docks can save significant cost and downtime when scaling up later.
Practical layout considerations include hygienic zoning, separation of people and material flow, distinct areas for fermented products versus fat products, and efficient loading for outbound refrigerated vehicles. Long-term revenue scalability can be severely constrained if site infrastructure does not allow incremental capacity addition or SKU diversification.
The Value-Added Dairy Plant Land, Building, Utilities & Hygienic Layout resource is the primary technical reference for this aspect.
Machinery Investment and Revenue Capacity
Machinery must be evaluated not just on purchase cost but on how it supports saleable output, flexibility of the value-added dairy product mix and operational efficiency over the project life. Commercially important aspects include:
- Automation level and resulting labour savings
- Faster CIP cleaning cycles and quicker changeovers between SKUs
- Lower downtime improving effective capacity utilisation
- Multi-product capability unlocking higher-margin categories
A Greek yogurt or probiotic line may appear to have higher machinery capex per litre than a basic dahi line, but if it unlocks contribution margins of 18–22% versus 10–12%, the investment can improve the overall dairy business financial model substantially. Promoters should reference the Value-Added Dairy Plant Machinery & Equipment Cost resource when making machinery and capacity selection decisions.
Project Cost and Means of Finance
From a financial structuring perspective, project cost for an Indian value-added dairy plant typically comprises land and building, plant and machinery, utilities, cold-chain infrastructure, pre-operative expenses, contingencies and margin for working capital.
Common means of finance include promoter contribution (equity), term loans from banks or financial institutions, applicable government subsidies (MSME, NHB, NABARD-linked schemes where eligible) and working capital limits. Each component needs servicing from dairy plant revenue streams-term loan EMIs from operating surplus, working capital limits from trade receivables and inventory, and equity returns from retained profit and growth.
DPR revenue projections must be tightly linked to production assumptions, pricing evidence and market absorption analysis rather than arbitrary year-on-year growth percentages. The Value-Added Dairy Plant Project Cost & Means of Finance resource provides a structured framework for aligning project funding with bank expectations.
Revenue Potential of Individual Value-Added Dairy Products
This section provides a comparative, product-wise view of revenue and margin potential across the major value-added categories. Actual margins depend on milk procurement price, scale, brand strength and channel mix-no standard margin can be promised.
| Product | Typical Customers | Shelf Life | Price Position | Key Commercial Risk | Indicative EBITDA Margin Range |
|---|---|---|---|---|---|
| Paneer | Retail, HoReCa, QSR, Institutions | 7–15 days (chilled) | Mass to Premium | Yield variability, cold-chain failure | 9–11% |
| Curd / Dahi | Retail, Institutions, Local Distribution | 5–10 days | Economy to Mass | Short shelf life, high returns | 10–12% |
| Industrial Yogurt | Retail, Modern Trade, Airlines, Cafeterias | 15–30 days | Mass to Premium | Competition from national brands | 10–14% |
| Greek Yogurt | Metro Retail, E-Commerce, Health-Focused | 20–30 days | Premium | Small volumes, high branding cost | 14–18% |
| Lassi | Retail, On-the-Go, Seasonal | 10–20 days (chilled) | Economy to Mass | Seasonal demand, logistics | 8–12% |
| Probiotic Dairy | Metro Retail, E-Commerce, Modern Trade | 15–30 days | Premium–Functional | Regulatory, R&D cost, slow adoption | 15–20% |
| Ghee | Retail, B2B (Mithai, Bakeries), Export | 6–12 months | Mass to Premium | Commodity price benchmarking | 6–8% |
Margin ranges are indicative and based on industry estimates. Actual results vary significantly by project.
For detailed technical and financial planning on individual products, promoters can refer to the respective project reports: Industrial Paneer Manufacturing Plant Project Report, Curd / Dahi Manufacturing Plant Project Report, Industrial Yogurt Manufacturing Plant Project Report, Greek Yogurt Manufacturing Plant Project Report, Industrial Lassi Manufacturing Plant Project Report and Probiotic Dairy Products Manufacturing Plant Project Report.
Illustrative Revenue Model for a Value-Added Dairy Plant
The following table presents an illustrative multi-product revenue model for a hypothetical plant processing approximately 1 lakh litres per day of milk equivalent, operating at varying utilisation levels across product lines in a stabilised year (Year 3 assumption).
| Product | Annual Production (MT) | Avg. Capacity Utilisation | Net Selling Price (₹/kg) | Est. Sales Revenue (₹ crore) | Share of Revenue |
|---|---|---|---|---|---|
| Paneer | 1,800 | 70% | 260 | 46.80 | 34% |
| Curd / Dahi | 3,600 | 75% | 55 | 19.80 | 14% |
| Yogurt (flavoured) | 900 | 65% | 140 | 12.60 | 9% |
| Greek Yogurt | 300 | 55% | 320 | 9.60 | 7% |
| Lassi / Chaas | 1,500 | 70% | 45 | 6.75 | 5% |
| Ghee | 600 | 60% | 500 | 30.00 | 22% |
| Butter & Cream | 450 | 60% | 280 | 12.60 | 9% |
| Total | ≈ 138.15 | 100% |
These figures are entirely illustrative and should not be treated as quotations, guaranteed selling prices or assured financial performance. Actual figures must be developed separately for each project based on location, procurement cost, product mix, capacity utilisation, brand positioning and competitive conditions.
Such a product-wise table feeds directly into DPR-level profit and loss projections, cash flow statements, DSCR calculations and IRR analysis. Bankers and investors expect this level of granularity.
Distribution Cost and Net Sales Realisation
What matters for the dairy plant revenue model is net realisation after all trade deductions, not the MRP printed on packs. Major deductions include:
- Distributor margin (typically 6–10%)
- Retailer margin (typically 10–18%)
- Promotional schemes and trade discounts (2–5%)
- Freight and cold-chain transport costs
- Market returns, expiry write-offs and damages (1–3% of sales for chilled products)
- Platform commissions for e-commerce and quick commerce (15–25%)
- Marketing support and listing fees for modern trade
Different channels have different deduction structures-institutional sales may involve lower trade margins but higher credit costs, while e-commerce commissions can be steep. Product-wise and channel-wise net realisation must be used in financial modelling.
Working Capital Implications of the Market Strategy
An aggressive dairy products distribution and sales strategy can increase working capital needs substantially, even when the P&L shows a healthy profit margin. The typical cash-flow pattern in dairy processing:
- Outflow: Daily or weekly payments for raw milk procurement (dairy farmers and local farmers expect prompt payment) and packaging materials with limited credit
- Inflow: 15–45 day receivables from distributors, 45–60 day receivables from modern trade and institutions
Products with longer shelf life (ghee, butter) may allow higher finished-goods inventory holding, while short shelf-life items like curd and yogurt require tight production–sales coordination but still tie up working capital in cold rooms and trade pipeline stock. Sustainability and traceability requirements add to packaging and compliance costs across the supply chain. Environmentally conscious consumers driving demand for responsible sourcing further influence packaging and logistics spend.
DPRs should contain a month-wise working capital assessment consistent with the chosen dairy products market strategy and channel mix, not just an annualised estimate.
Key Market Risks in Value-Added Dairy Processing
| Risk | Description | Mitigation |
|---|---|---|
| Raw milk price volatility | Milk procurement costs can spike due to feed cost inflation or seasonal shortage. Feed costs rose faster than milk prices in the early 2020s, squeezing margins. | Diversify procurement across multiple routes; consider forward contracts with dairy farmers; maintain price flexibility in finished product pricing. |
| Market competition | Established cooperatives and national brands create intense competition. Dairy farmers in some global markets face significant marketing-related barriers. | Focus on regional strengths, quality differentiation and niche products rather than head-to-head price wars. |
| Cold-chain failure | Temperature excursions during transport or storage cause spoilage and returns. | Invest in real-time temperature monitoring, reliable refrigerated vehicles and backup power for cold rooms. |
| Product expiry and returns | Short shelf life of chilled dairy means unsold stock becomes waste. | Tight production planning, FIFO stock rotation, and realistic demand forecasting reduce write-offs. |
| Distributor dependency | Over-reliance on one or two distributors concentrates revenue risk. | Build a multi-distributor network across geographies; develop parallel institutional and D2C channels. |
| Slow product adoption | Premium or functional products (probiotic, Greek yogurt) may take longer to achieve volumes. | Phase premium launches after core staples stabilise; invest in consumer education and sampling. |
| Working capital strain | Aggressive growth can create cash-flow gaps even in a profitable business. | Model month-wise cash flow; maintain adequate working capital limits; align credit terms with receivable cycles. |
| Customer concentration | Heavy dependence on one institutional buyer or modern trade chain. | Cap single-customer revenue share at 15–20%; diversify across customer types and geographies. |
Investors and bankers carefully review how these risks are recognised and mitigated within the DPR and dairy products business strategy. A volatile market requires robust contingency planning.
Revenue Strategy for a New Dairy Plant: Phased Approach
Phase 1 – Local Market Validation
Focus on nearby city markets and immediate institutional clients within 100–150 km. The objective is stabilising product quality, building initial consumer feedback loops and establishing baseline cash flow. Direct sales to local HoReCa and retail outlets in this phase help validate product-market fit.
Phase 2 – Distributor Development
Appoint and train distributors across the region, activate trade schemes, and build cold-chain coverage. This phase demands investment in agricultural marketing fundamentals-route planning, retailer servicing, scheme management and market competition monitoring. The growing demand for processed milk products creates a favourable environment, but execution rigour determines outcomes.
Phase 3 – Product Portfolio Expansion
Once core lines (paneer, dahi) achieve stable demand, introduce higher-margin products-yogurt, Greek yogurt, probiotic variants, premium ghee. This phase lifts the dairy product contribution margin profile without proportionally increasing fixed costs. The dairy industry is evolving rapidly, and food safety standards must be maintained across all new product introductions.
Phase 4 – Regional Expansion
Expand cold chain, warehousing and distribution into adjoining states and metro markets. Evaluate entry into modern trade and e-commerce. This phase tests the plant’s ability to serve increasing demand across wider geographies while maintaining quality control and service levels.
Phase 5 – Institutional and B2B Scale-Up
Develop long-term bulk contracts with QSR chains, food processors and export buyers where commercially appropriate. These contracts provide volume visibility and support dairy plant capacity utilisation, complementing the retail brand’s growth.
Promoters should avoid expanding into too many states or channels faster than production, infrastructure and working capital systems can support, as this can critically strain the dairy business financial model and rural development impact.
Financial Information Required for DPR Revenue Projections
A robust DPR for a value-added dairy processing plant requires these key inputs:
- Installed capacity and planned value-added dairy product mix
- Product-wise yield assumptions (kg of output per litre of milk)
- Year-wise capacity utilisation ramp-up schedule
- Selling prices by product, channel and pack size (with net realisation calculations)
- Trade margin and scheme structures by channel
- Expected returns, damages and expiry write-offs
- Raw milk procurement price and seasonal variation
- Packaging, utilities, labour and logistics costs
- Marketing and brand-building expenditure phasing
- Fixed costs including depreciation, insurance, administration
- Working capital calculations (inventory, receivables, payables)
- Term loan repayment schedule and interest obligations
These inputs flow into projected Profit & Loss statements, Cash Flow statements and Balance Sheets for at least 5–7 years. Bank-focused metrics include DSCR (Debt Service Coverage Ratio), break-even volume, contribution margin, ROI, IRR and payback period. Realistic revenue modelling and in depth analysis of market assumptions directly support loan assessment and farm management of financial resources.
Role of a Detailed Project Report in Dairy Market Planning
A Detailed Project Report should integrate technical design-capacity, machinery, layout, cold chain-with the value-added dairy products revenue model and dairy products market strategy. Treating these as separate documents creates disconnects that banks and investors immediately identify.
The DPR serves as a decision-support tool for promoters, helping test scenarios on product mix, pricing, utilisation and funding structure before committing significant fixed assets. It enables data collection and analysis on whether the project’s economic performance can sustain debt service, generate returns for equity and fund future growth.
Lenders in India rely on DPR quality, underlying assumptions and logical linkages between capacity, market absorption and revenue when assessing dairy plant proposals. A generic report with boilerplate numbers will not pass muster for a project seeking ₹10–50 crore in term loans.
Professional Support from CA Manish Gugliya
CA Manish Gugliya is a practising Chartered Accountant specialising in DPR preparation, project finance, CMA data, financial feasibility and bank loan assessment for value-added dairy plants and agro processing projects. Key services include:
- Detailed Project Reports (bank-finance and investor-ready)
- CMA Data preparation and assistance
- Financial projections and sensitivity analysis
- Project cost and means of finance structuring
- Working capital and term loan assessment
- DSCR, break-even, ROI and IRR analysis
- Project feasibility and business valuation advisory
- Investor pitch decks where applicable
These services focus on preparation, analysis and advisory. They do not guarantee loan sanctions or specific profitability outcomes. Entrepreneurs planning substantial value-added dairy projects can engage these services through www.projectreportbank.com.
Frequently Asked Questions
Which value-added dairy products usually offer higher contribution margins in India?
Specialty cheese (16–18% EBITDA margin), Greek yogurt (14–18%) and probiotic dairy products (15–20%) typically show higher contribution margins compared to basic curd (10–12%) or ghee (6–8%). However, actual margins depend heavily on raw milk procurement price, brand strength, capacity utilisation, channel mix and competitive intensity. A product that delivers high margins at 70% utilisation in one region may underperform in another where milk and dairy products procurement costs are higher or where market competition from cooperatives suppresses selling prices. Promoters should model product-wise margins specific to their project location and milk market conditions.
How do I decide the right product mix for my value-added dairy plant?
Start by assessing local demand gaps-which milk based products are underserved in your target market? Then evaluate your milk composition: buffalo milk with higher fat content suits paneer and ghee, while cow milk with higher SNF may favour curd and yogurt. Factor in your available cold-chain infrastructure, competitive intensity from existing players like Mother Dairy or regional cooperatives, and your capital budget. The practical approach is to anchor on two or three high-volume staples for base utilisation and add one or two high-margin niche products that improve profitability and improve the overall portfolio’s competitive advantage. Avoid launching too many SKUs simultaneously-this is a common mistake in the dairy sector that dilutes focus and increases waste.
What level of capacity utilisation should I assume in the first three years of operation?
Rather than assuming a single percentage, model a realistic ramp-up curve: 40–60% in year one, 60–75% in year two, and 70–85% by year three. These ranges are consistent with industry practice-even well-managed plants like AmulFed operate at around 74% overall, with specific product lines varying from 49% (butter) to 98% (fermented products). Your actual ramp-up will depend on distribution build-out pace, marketing investment and regional demand absorption. Banks are sceptical of projections showing 85–90% utilisation from year one for any greenfield dairy processing project.
How much distributor and retailer margin is typical for value-added dairy products?
Distributor margins typically range from 6% to 10% of MRP depending on product category and volume commitment, while retailer margins range from 10% to 18%. Premium and niche products like probiotic yogurt may carry higher retailer margins (15–18%) to incentivise shelf space, while high-velocity staples like dahi may operate with 10–12% retail margin. Modern trade and e-commerce channels involve additional deductions-listing fees, promotional contributions, platform commissions-that can take total trade deductions to 20–30% of MRP. Every dairy product pricing strategy must model net realisation after all these deductions, not revenue at MRP.
What documents and data will my bank expect regarding the revenue model?
Banks typically expect product-wise sales projections for 5–7 years, clearly stated assumptions behind pricing and volumes, a documented channel strategy, working capital calculations linked to credit periods and inventory norms, sensitivity analysis showing impact of changes in milk price, utilisation and selling price on DSCR, and a summary of key market risks with mitigation strategies. All of these must be internally consistent with the DPR’s technical sections on capacity, machinery and manufacturing process. A professionally prepared DPR from an experienced practitioner substantially strengthens the project’s credibility during the milk processing loan assessment process, especially for projects in the global dairy market context where Indian dairy farming is scaling rapidly to meet increasing demand and consumer demands for high quality dairy products.
Conclusion
A robust value-added dairy products revenue model is built on realistic product-wise volumes, net selling prices after all trade deductions, contribution margins by product and channel, distribution costs, capacity utilisation assumptions and working capital implications. It is not a spreadsheet exercise of multiplying installed capacity by MRP.
Plant capacity must be aligned with achievable market absorption. The most effective dairy products market strategy combines retail, HoReCa, institutional, B2B and premium segments rather than relying entirely on one channel or one product. India’s dairy market growth and the rapid expansion of the value added business segment provide a strong tailwind, but only for promoters who approach the opportunity with disciplined financial planning and realistic commercial assumptions.
Avoid generic thumb rules. Instead, develop a customised, data-driven value-added dairy business model backed by a professional DPR and financial feasibility assessment tailored to your specific location, procurement economics, product mix and market conditions.
Entrepreneurs and investors planning substantial value-added dairy processing projects in India are invited to engage CA Manish Gugliya through www.projectreportbank.com for tailored DPR preparation, financial modelling and project finance advisory.