
Key Takeaways
- UHT milk plant profitability depends on contribution per litre, capacity utilisation, product mix and financing structure-not on “high demand” alone.
- A realistic UHT milk plant break-even analysis requires validated assumptions on milk procurement cost, aseptic packaging expense, utilities, fixed overheads and interest on borrowed capital.
- All numerical examples in this article are illustrative only. Actual UHT milk plant profit margin in India varies by plant capacity, location, technology, market access and management quality.
- Banks, investors and promoters focus on UHT milk production cost per litre, contribution margin and debt-service capacity before approving or committing funds.
- Promoters should prepare a project-specific DPR, CMA Data and financial model before locking in plant capacity, complete production line design or loan structure.
Introduction: Why Profitability and Break-Even Matter More Than “High Demand”
The global UHT milk market reached 130.97 billion litres in 2025 and is projected to reach 205.42 billion litres by 2034, driven by urbanisation and cold-chain limitations in developing economies. Consumers increasingly prefer long-shelf-life dairy products for convenience. In India, rising demand for ambient dairy, steadily increasing dairy exports and stable demand in urban and semi-urban markets make UHT milk production an attractive proposition on paper.
Yet strong consumer demand and advanced machinery do not automatically ensure UHT milk plant profitability. A UHT milk processing plant can only be viable when milk procurement price, aseptic packaging cost, net sales realisation, plant utilisation, distribution structure and finance costs are in the right balance. UHT milk processing plant setup costs include machinery and land, but capital outlay is only one variable in a complex equation.
This article focuses on the financial analysis: profit per litre, UHT milk plant break-even analysis, capacity utilisation risk and sensitivity. For detailed discussions on capital investment and equipment selection, readers may refer to the guides on UHT milk processing plant setup cost in India and UHT milk plant machinery and equipment cost. These influence profitability but do not define it.
What Does UHT Milk Plant Profitability Actually Mean?
“Profit per litre” is frequently quoted in casual feasibility discussions, but for a capital-intensive dairy processing plant, profitability must be understood at multiple levels. A small dairy processing plant can achieve profit margins of 20–40% at certain levels, while net profit margins in UHT operations usually lie between 10% and 15% at stabilised capacity. These ranges, however, are meaningless without understanding how they are measured.
Key profitability levels to track in a UHT milk plant financial analysis:
- Contribution per litre: net realisation minus variable costs-the building block for break-even
- Gross operating surplus: contribution minus cash fixed costs (excluding depreciation and interest)
- EBITDA margin: earnings before interest, tax, depreciation and amortisation as a percentage of net revenue
- EBIT: EBITDA minus depreciation-reflects cost of asset consumption
- Profit before tax (PBT) and profit after tax (PAT)
- Cash accrual: PAT plus depreciation-the actual cash generated for debt repayment and reinvestment
At the project level, financial projections include ROI and net present value assessments. Return on capital employed measures project-level viability, while equity IRR measures the promoter-level return after accounting for leverage. A plant may show accounting profit but still face cash-flow stress during ramp-up years when working capital demands are high and utilisation is low.
Lenders reviewing a UHT milk plant DPR for bank loan focus on sustainable EBITDA, cash accrual and debt-service coverage ratio (DSCR)-not just projected PAT in Year 5.
Major Revenue Drivers in a UHT Milk Processing Plant
UHT milk manufacturing business profit starts with realistic revenue assumptions-specifically the net sales realisation received by the manufacturer, not the consumer-facing MRP.
Revenue drivers include:
- Installed and practical capacity: a UHT milk processing plant can produce 100–200 million litres annually at scale, but practical annual capacity depends on operating days, maintenance downtime and line efficiency. Detailed capacity assumptions should align with UHT milk plant capacity planning and line balancing.
- Capacity utilisation: the percentage of practical capacity actually used in a given year, typically 50–70% during ramp-up and 80–90% at stabilisation.
- Product mix: plain UHT milk, flavoured milk, cream variants, institutional packs versus retail packs-each carries different margins.
- Net sales realisation: gross selling price minus distributor margins, retailer margins, trade schemes, returns, breakages and applicable GST. All profitability calculations must use this figure, not MRP.
- Channel mix: modern trade, general trade, HoReCa, institutional, private label and exports can materially change UHT milk plant sales volume and break-even calculation at the same installed capacity.
UHT milk distribution eliminates the need for refrigerated transport, reducing logistics costs-a structural advantage over pasteurized milk and fresh cheeses that require refrigeration.
Major Cost Components Affecting UHT Milk Plant Profit Margin
UHT milk plant cost and profit depend on correctly identifying and classifying both variable costs and fixed costs. Misclassification can seriously distort the financial analysis.
Variable Costs
- Raw milk procurement (fat and SNF specifications, seasonal variation)
- Aseptic packaging material (carton laminate, closures, secondary and tertiary packaging)
- Utilities linked to production: fuel, steam, electricity, water-energy costs represent about 10% to 15% of operating expenses for UHT plants
- Process losses and product wastage during UHT processing (heating milk to temperatures between 135°C and 150°C) and filling
- Cleaning chemicals and CIP consumables
- Production-linked labour, quality control consumables
- Freight, distribution and sales commissions
Actual energy, steam and CIP-related costs must be supported by realistic consumption norms such as those discussed under UHT milk plant utilities including power, steam, water and CIP.
Fixed and Semi-Fixed Costs
- Permanent salaries and administrative expenses
- Repairs, regular maintenance and insurance
- Factory overheads, quality assurance infrastructure
- Marketing and brand-development expenses
- Depreciation (equipment typically at 12.5% p.a. over 8-year useful life)
- Interest on term loan and working capital
- Compliance and professional costs
In most UHT milk plants, raw material (raw milk) and aseptic packaging are the two largest cost components, but their relative share varies depending on fat/SNF formula, pack size and technology choice-for example, direct versus indirect UHT milk processing technology affects both energy consumption and capital cost. Aseptic packaging costs can rival or exceed processing costs per unit, particularly for smaller retail packs.
UHT Milk Production Cost Per Litre: Building an Illustrative Cost Sheet
The following table provides an illustrative cost build-up for UHT milk production cost per litre. These figures are not industry averages, quotations or guaranteed costs-they exist solely to demonstrate the structure of a cost sheet.
| Cost Head | Illustrative ₹/Litre |
|---|---|
| Raw milk procurement (6% fat) | 40.00 |
| Standardisation / fat adjustment | 1.50 |
| Processing loss (~0.5%) | 0.20 |
| Aseptic packaging material | 8.00 |
| Utilities (power, steam, water) | 3.50 |
| Chemicals, sanitation, CIP | 0.25 |
| Direct labour (production-linked) | 1.00 |
| Quality control consumables | 0.15 |
| Freight and distribution | 2.50 |
| Factory overhead allocation | 1.50 |
| Administrative and selling overheads | 1.50 |
| Depreciation (allocated) | 2.50 |
| Interest (allocated) | 1.80 |
| Total cost per litre | ~64.40 |
Note: All figures are purely illustrative. Actual costs depend on location, scale, procurement arrangements, technology, packaging format and financing terms.
Raw milk accounts for 70–80% of total operating expenses in many configurations, making procurement price the single most powerful lever on total cost. Several cost heads link directly to process steps described in the UHT milk manufacturing process and flow chart and sterile handling outlined under aseptic filling and packaging process for UHT milk.
Because overhead, depreciation and interest are allocated per litre based on projected annual output, cost per litre decreases as capacity utilisation improves-a critical dynamic during ramp-up years.
Contribution Margin Per Litre and Its Importance
Contribution per litre is the core metric for UHT milk plant profitability calculation and break-even assessment. It measures how much each litre of milk produced and sold contributes toward covering the plant’s fixed costs.
Contribution per litre = Net sales realisation per litre − Variable cost per litre
Variable costs include milk, packaging material, utilities, process loss, freight, sales commission and trade schemes directly linked to volume.
Illustrative calculation:
- Assumed net realisation per litre: ₹68
- Variable cost per litre: raw milk ₹40 + packaging ₹8 + utilities ₹3.50 + chemicals ₹0.25 + freight/commissions ₹3.50 + loss/other ₹0.75 = ₹56
- Contribution per litre: ₹68 − ₹56 = ₹12
Now consider a ₹4 increase in raw milk price (from ₹40 to ₹44). Contribution drops from ₹12 to ₹8-a 33% decline from a 10% input cost movement. This demonstrates why even small shifts in milk price or net realisation can materially change the break-even picture.
UHT milk processing plants have gross profit margins of 25–35% in many operating models, but contribution is not accounting profit-it ignores fixed costs such as salaries, depreciation and interest that still must be covered. Contribution should ideally be analysed pack-wise and product-wise, aligned with the commercial structure discussed under UHT milk plant revenue model and product mix.
UHT Milk Plant Break-Even Analysis: Concepts and Formulas
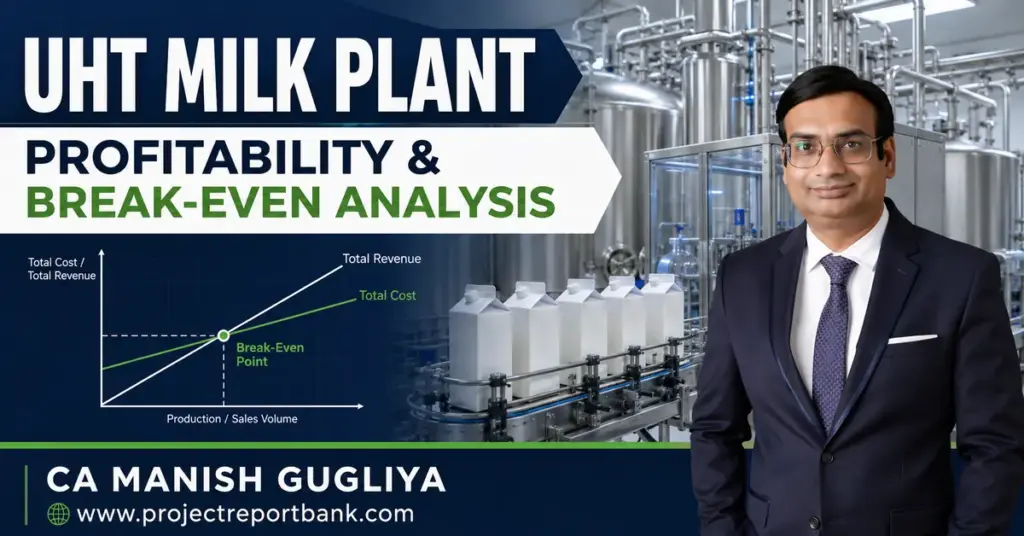
UHT milk plant break-even analysis identifies the production volume or net sales value at which total contribution equals relevant fixed costs-neither profit nor loss.
Core formulas:
- Break-even volume (litres) = Annual fixed cost ÷ Contribution per litre
- P/V ratio = Contribution per litre ÷ Net sales realisation per litre
- Break-even sales value = Annual fixed cost ÷ P/V ratio
- Break-even capacity utilisation (%) = Break-even volume ÷ Practical annual capacity × 100
Different break-even definitions serve different purposes:
- Operational break-even: fixed operating costs (excluding depreciation and interest) covered by contribution
- EBITDA break-even: all cash operating costs covered
- Accounting break-even: zero PAT-depreciation and interest included
- Cash break-even: operating cash flow is non-negative after adjusting for non-cash charges
- Debt-service break-even: cash accrual covers scheduled term-loan repayment plus interest
In any UHT milk plant DPR for bank loan, the definition being used must be stated explicitly. Practical annual capacity should reflect realistic operating days and line efficiency, not just nameplate rating.
Illustrative Break-Even Calculation for a UHT Milk Plant
The following step-by-step example is illustrative only. All figures must be replaced with project-specific data before use.
Assumptions (Year 3, stabilised operations):
- Installed capacity: 10,000 litres per day
- Operating days: 330 per year
- Practical annual capacity: 33,00,000 litres (33 lakh litres)
- Assumed capacity utilisation: 85%
- Saleable production (after 0.5% process loss): ~27,86,000 litres
- Net realisation per litre: ₹68
- Variable cost per litre: ₹56
- Contribution per litre: ₹12
Fixed costs (excluding depreciation and interest):
- Salaries, overheads, insurance, maintenance: ₹85 lakh per year
Operational break-even volume = ₹85,00,000 ÷ ₹12 = 7,08,333 litres → approximately 21.5% of practical annual capacity
Adding depreciation and interest:
- Depreciation: ₹30 lakh per year (consistent with typical equipment depreciation on project cost structures discussed under UHT milk plant project cost and means of finance)
- Interest on term loan and working capital: ₹28 lakh per year
- Total fixed costs (including depreciation and interest): ₹1,43,00,000
Accounting break-even volume = ₹1,43,00,000 ÷ ₹12 = 11,91,667 litres → approximately 36% of practical annual capacity
This demonstrates that EBITDA break-even may be reached earlier than accounting break-even. The gap between the two represents the additional volume needed to absorb depreciation and finance costs.
Caution: These are method illustrations. Actual UHT milk plant operating cost, net realisations and capital cost must be derived from current quotations, local milk-procurement data, realistic financing terms and market validation.
Capacity Utilisation, Operating Leverage and Ramp-Up Risk
A UHT milk processing plant typically experiences low utilisation in Year 1 and sometimes Year 2. High-capacity utilisation is crucial for profitability due to high fixed costs, yet achieving it takes time.
Typical ramp-up factors include:
- Commissioning, sterile validation and trial runs
- Market development and distributor appointments
- Credit-term negotiation and brand awareness building
- Learning curve on the aseptic filling line
- Operating costs increase significantly by the fifth year of operation as maintenance and replacement needs grow
AmulFed’s UHT-category plants achieved approximately 74% annual capacity utilisation in 2024–25, which is considered healthy in the Indian dairy industry.
Illustrative impact of utilisation on fixed cost per litre (example only):
| Utilisation | Annual Output (lakh litres) | Fixed Cost/Litre (₹) | Illustrative EBIT Margin |
|---|---|---|---|
| 40% | 13.2 | 10.83 | Negative |
| 60% | 19.8 | 7.22 | Low single-digit |
| 85% | 28.1 | 5.09 | Moderate positive |
These percentages and margins are only examples-not industry benchmarks.
Operating leverage works both ways: improvements in utilisation can significantly increase profit margins, but underutilisation can push an otherwise sound plant into losses. Lenders carefully examine projected capacity utilisation and the time required to reach stabilised throughput when assessing UHT milk plant financial feasibility.
Product Mix, Pack Size Economics and Net Realisation
UHT milk plant profitability is highly sensitive to product mix and pack-size decisions-not just aggregate volume.
- Full-cream, toned, double-toned and standardized milk each carry different raw material costs and realisations
- Value-added UHT products, such as flavoured milks, yield significantly higher margins but require market development and sometimes different formulation infrastructure
- Smaller pack sizes (200ml, 500ml) can command higher per-litre realisation but involve higher per-litre packaging cost and freight, especially with paper-based aseptic cartons as outlined under aseptic carton packaging systems for UHT milk
- Private-label manufacturing for retailers or foodservice may offer lower realisation but simpler marketing requirements and more predictable volume, aiding fixed-cost absorption
- Local brands are preferred over national players in Tier-2 and Tier-3 cities, presenting both an opportunity and a market-development challenge
A realistic DPR should include pack-wise contribution analysis rather than assuming one uniform margin across all dairy products and milk products.
Sensitivity Analysis and Margin of Safety
Sensitivity analysis tests how changes in key variables affect UHT milk plant profitability and break-even period in India. In a dairy business dependent on volatile milk prices and imported carton materials, this is not optional.
Variables to test: raw milk purchase price, aseptic packaging cost, net sales realisation, capacity utilisation, processing loss, utility cost, freight and trade margins, interest rate and working-capital cycle.
Illustrative sensitivity (example only):
| Scenario | Change | Effect on Contribution/Litre | Effect on Break-Even Volume |
|---|---|---|---|
| Milk price +5% (₹40→₹42) | +₹2 variable cost | Drops from ₹12 to ₹10 | Increases by ~20% |
| Net realisation −5% (₹68→₹64.60) | −₹3.40 revenue | Drops from ₹12 to ₹8.60 | Increases by ~40% |
| Packaging cost +10% (₹8→₹8.80) | +₹0.80 variable cost | Drops from ₹12 to ₹11.20 | Increases by ~7% |
| Utilisation drops to 60% | Lower volume | No change per litre | Fixed cost spread over fewer litres |
Margin of safety formulas:
- Margin of safety (value) = Projected sales − Break-even sales
- Margin of safety (%) = (Projected sales − Break-even sales) ÷ Projected sales × 100
A low margin of safety (below 15–20%) signals vulnerability. This is particularly dangerous in the dairy industry where milk procurement prices can swing 10–15% between flush and lean seasons, and packaging material costs are exposed to foreign exchange movements.
Profitability Versus Cash Flow in a UHT Milk Plant
A UHT milk plant can show accounting profits yet face cash shortages-a distinction that promoters often underestimate.
Cash-flow pressures arise from:
- High initial stocks of packaging material and finished products in the distribution pipeline
- Credit extended to distributors and institutional buyers
- Prompt payment obligations to farmers and milk suppliers for raw milk
- GST outflows and statutory dues with fixed timelines
- Term-loan instalments during ramp-up years when milk produced has not yet translated into receivable collections
- Seasonal variations in milk procurement prices and availability
Operating cost projections must be accompanied by a realistic working capital assessment, typically detailed in a DPR and linked to financing structure as discussed under UHT milk plant project cost and means of finance. While a Chartered Accountant can prepare cash-flow projections and CMA Data, such projections are estimates based on assumptions and do not guarantee future cash sufficiency.
How Banks and Financial Institutions Appraise UHT Milk Plant Profitability
Lenders in India evaluate UHT milk plant financial feasibility through a disciplined, assumption-based review. They do not rely on generic industry margins or optimistic feasibility report assumptions.
Appraisal focus areas:
- Milk availability, procurement arrangements and raw milk reception infrastructure
- Realistic capacity utilisation build-up over 3–5 years
- Product-wise contribution and net-realisation assumptions
- UHT milk plant fixed and variable cost analysis
- Robustness of contribution per litre across scenarios
Key metrics examined:
- EBITDA margin and cash accrual adequacy
- Break-even capacity utilisation percentage
- Margin of safety
- DSCR (Debt Service Coverage Ratio)
- Working-capital adequacy and inventory cycle
- Promoter contribution and total investment structure
Banks expect consistency among the DPR, CMA Data and loan application. Quotations for machinery, packaging and utilities must support the cost assumptions-for example, quotations underlying UHT milk plant machinery and equipment cost estimates.
No particular profit margin, break-even ratio or payback period guarantees loan approval. Financing decisions also depend on promoter profile, collateral, banking history and overall risk assessment.
Common Mistakes in UHT Milk Plant Profitability Calculations
Small errors in assumptions can produce unrealistic projections that undermine credibility with lenders and investors.
Frequent errors include:
- Using MRP instead of manufacturer’s net realisation
- Ignoring distributor and retailer margins in revenue assumptions
- Underestimating aseptic-carton cost, especially for small pack sizes
- Assuming immediate full-capacity operation from Day 1
- Ignoring process and packaging losses that occur during the manufacturing process-losses documented in the UHT milk manufacturing process and flow chart
- Treating all expenses as fixed or all as variable
- Omitting marketing, staff training and brand-building costs
- Ignoring working-capital interest or using outdated quotations for milk, utilities or advanced machinery
- Mixing cash break-even with accounting break-even
- Presenting uniform margin percentages for every product and pack size
- Claiming “industry standard” profitability without backing data in a DPR submitted for bank appraisal
Practical Measures to Improve UHT Milk Plant Profitability (Without Compromising Quality)
The objective is to improve operational efficiency and reduce avoidable costs while maintaining FSSAI-compliant food safety, shelf life integrity and product quality as tested under UHT milk quality control and shelf-life testing.
- Strengthen milk-procurement networks through direct farmer linkages and milk reception centres to stabilise both quality and pricing
- Improve capacity utilisation through aggressive but realistic market development
- Optimise product and pack-size mix based on channel-wise demand and contribution analysis
- Monitor and reduce avoidable processing and packaging losses
- Implement regular maintenance schedules for heat exchanger units, cream separator equipment and filling lines
- Track energy and CIP chemical consumption against benchmarks
- Negotiate packaging-material contracts based on volume commitments and payment terms
- Manage inventory and receivables actively to reduce working capital interest burden
The Indian government offers various subsidies for dairy startups. NABARD provides 25% to 33.33% capital subsidies for eligible dairy projects. The PMFME scheme offers grants up to ₹10 lakhs for micro food processors. State governments provide reduced land costs and electricity exemptions in select zones. These forms of financial assistance can improve the total investment economics, though they should not be the primary basis for viability.
Cost-cutting must never compromise aseptic packaging integrity, pollution control compliance or shelf-life performance. False economies here can destroy both brand reputation and long-term success.
Information Required for a Project-Specific UHT Milk Plant Financial Analysis
Promoters should compile the following before requesting a DPR, CMA Data or funding appraisal:
Technical and operational inputs:
- Proposed location and site development plan (a 500-litre-per-day plant requires 1,500 to 2,000 square feet; larger plants need proportionally more, aligned with UHT milk plant land, building and hygienic layout requirements)
- Installed and practical capacity, plant layout, proposed technology and number of operating days
- A small dairy processing plant costs between ₹20 and ₹30 lakhs at the entry level, while mid-size and large plants require significantly higher capital
Procurement and commercial inputs:
- Raw milk availability, procurement price assumptions, fat/SNF specifications
- Product mix, pack sizes and packaging format, referencing specifications for aseptic carton packaging systems for UHT milk
- Channel-wise net realisations, target markets, distributor and retailer margins, freight and logistics costs
- Marketing budget and expected ramp-up profile
Regulatory requirements:
Three essential licenses are required for dairy plants in India: FSSAI Manufacturing Licence (mandatory for all dairy processing), State Pollution Control Board NOC for environmental impact clearance, and Local Body Trade Licence from municipal authorities. GST registration is required if turnover exceeds ₹20 lakhs annually. MSME Udyam Registration grants access to government scheme benefits.
Finance inputs:
- Total project cost, means of finance (debt–equity mix), term-loan amount and tentative interest rate
- Working capital assumptions, depreciation method, tax assumptions and proposed repayment schedule
Role of a Customised DPR in Assessing UHT Milk Plant Cost and Profit
In my experience preparing DPRs for dairy processing plant projects across India, the single most common gap is the absence of a structured link between technical parameters and financial outcomes. A well-prepared Detailed Project Report converts a technical dairy processing concept into a financial plan that can withstand scrutiny.
A DPR should integrate:
- Technical capacity and annual output projections
- Product mix and value chain assumptions
- Project cost and means of finance
- UHT milk plant operating cost structure
- Projected profitability, break-even analysis and UHT milk project sensitivity analysis
- Working-capital assessment and cash-flow projections over the repayment period
- Scenario planning covering milk price shocks, carton-cost changes, slower capacity ramp-up and interest rate variation
All assumptions must be project-specific, supported by vendor quotations, utility estimates and market validation. While a Chartered Accountant can help prepare and defend the DPR and related CMA Data, neither the DPR nor the financial projections constitute a guarantee of plant performance, profit margins or loan sanction. The UHT milk market is projected to reach USD 205.42 billion by 2034-the opportunity exists, but capturing it requires business requirements that are rigorously validated at the project level through a proper feasibility study.
Frequently Asked Questions
Is a UHT milk processing plant profitable in India?
UHT milk plant profitability in India depends on location, milk-procurement ecosystem, achievable net realisation, capacity utilisation, product mix and financing terms. There is no single standard profit margin applicable to all plants. Well-planned plants can achieve attractive returns once stabilised, while others may struggle if assumptions on volume, pricing or costs are unrealistic. High demand for liquid milk and rising demand in urban India are encouraging, but promoters should insist on a project-specific break-even and sensitivity analysis rather than relying on generic claims.
How do aseptic cartons and packaging choices affect UHT milk plant profitability?
Aseptic carton cost is one of the largest variable cost components after raw milk, especially for small retail pack sizes. In some configurations, packaging cost can account for 20–25% of the final product cost. Different pack sizes create different balances between per-litre packaging cost and achievable net realisation. Promoters should use current quotations from suppliers like Tetra Pak or equivalent providers and test pack-wise contribution before finalising the product mix. The choice between cream separation for by-products and whole-milk processing also influences cost allocation across the value chain.
Should break-even be calculated on installed capacity or practical capacity?
Break-even capacity utilisation should always be measured against practical annual capacity-installed rating adjusted for realistic operating days, maintenance downtime and line efficiency. Using gross installed capacity gives an artificially low break-even percentage and can mislead lenders. Practical capacity estimates should reflect actual operating conditions rather than nameplate specifications.
Can a UHT milk plant be profitable at low capacity utilisation?
It is unlikely. With high fixed costs for equipment, salaries, insurance and interest, low utilisation means these costs are spread across fewer litres, pushing cost per litre above net realisation. Most plants need to achieve at least 55–65% practical capacity utilisation to reach accounting break-even, though the exact threshold depends on contribution per litre and the fixed-cost structure. Cream separator and heat exchanger equipment carry depreciation whether running or idle.
Does a favourable break-even analysis guarantee bank finance for a UHT milk project?
No. A sound break-even analysis is necessary but not sufficient. Banks also evaluate promoter experience, collateral, market risk, project implementation capability and regulatory compliance. Lenders run their own sensitivity checks on milk procurement, sales assumptions, profit margins and utilisation before taking a decision. No financial projection, however well prepared, can guarantee loan sanction-it can only support a professional, transparent appraisal process.
Conclusion: Using Break-Even Analysis to Build a Disciplined UHT Milk Business
UHT milk plant profitability is driven by disciplined planning and execution around milk procurement, aseptic packaging, plant utilisation, product mix, net realisation and financing-not by any single assumed margin or high demand benchmark. Whether you are processing standardized milk for retail cartons or flavored milk for higher margins, the economics must be validated at the project level.
Project-specific UHT milk plant break-even analysis, sensitivity testing and realistic capacity build-up plans are essential before committing capital or approaching lenders. The environmental impact, infrastructure requirements and site development costs vary by location, making each project unique.
For a customised UHT milk plant DPR, financial projections, CMA Data assistance, break-even modelling and bank-loan assessment support, promoters and dairy companies are welcome to contact CA Manish Gugliya through ProjectReportBank.com. No guarantee is made regarding profitability, milk processing plant performance or loan approval-but a professionally prepared, assumption-backed financial analysis significantly strengthens the foundation for informed decision-making and credible lender engagement.