
Key Takeaways
- Integrated rice processing plant financial projections must cover multiple product lines, by-product streams, working capital sizing, term loans and DSCR – a single-line rice mill model is never sufficient for an integrated project.
- Projected Profit & Loss, Balance Sheet, Cash Flow Statement, working capital assessment and DSCR together determine whether an integrated rice plant is financially feasible and bankable for bank finance in India.
- Working capital for paddy stocking and finished goods inventory is often massive – sometimes rivalling the capital expenditure on land, building and machinery – and must be sized carefully around seasonal procurement cycles.
- DSCR calculation for the rice processing plant project, both year-wise and as an average, is central to assessing loan repayment capacity. Projected profit margins alone do not satisfy bank appraisal requirements.
- Project Report Bank, led by CA Manish Gugliya, prepares customised Rice Processing Plant Project Reports, CMA Data and financial models tailored to each project’s capacity, product mix and financing pattern.
Introduction: Why Financial Projections Matter More in an Integrated Rice Plant
Unlike a simple single-line rice mill, an integrated rice processing plant handles multiple processing lines – milling, parboiling, sortex grading, poha, puffed rice, snacks, retail packaging and by-product utilisation. Each line introduces separate revenue streams, cost structures and inventory cycles. This complexity makes financial projections, working capital sizing and DSCR analysis substantially more involved than for a standalone rice mill business.
Consider a typical medium-to-large integrated rice plant in India handling 120–200 TPD of paddy, with rice milling, parboiled rice, poha, puffed rice and branded packaging under one roof. The global rice market was valued at USD 316.58 billion in 2025, and the rice industry in India continues to attract significant investment. Rice processing requires multiple steps including cleaning, parboiling, milling and polishing, and each step adds to both the cost and revenue complexity. Market research is essential for rice mill feasibility studies before committing capital to such a multi-line project.
Bankers, investors and promoters now expect a full set of integrated rice processing plant financial projections – including projected P&L, Balance Sheet, Cash Flow Statement, working capital and DSCR – before considering bank finance for an integrated rice plant in India. All figures in this article are illustrative only. Actual numbers depend on project cost, production capacity, raw materials pricing, location, financing pattern and business plan execution. Under India’s Agriculture Infrastructure Fund, 92,393 projects have received INR 56,334 crore in financial assistance, reflecting the scale of institutional support available for agri-processing infrastructure.
CA Manish Gugliya and Project Report Bank bring extensive experience in preparing rice processing plant project reports, CMA Data and integrated rice plant financial analysis for MSME loans and term loan assessment.
What Are Financial Projections for an Integrated Rice Processing Plant?
Financial projections for an integrated rice processing plant are structured 5–7 year forecasts covering profitability, cash flows, assets created, liabilities and loan servicing for the entire integrated project – not only the rice mill line.
Projections typically include a detailed projected Profit and Loss Account showing year-wise sales (product-wise), cost of raw materials including paddy, operational costs, depreciation, interest and Profit After Tax. The projected Balance Sheet captures capital expenditure on land, building, integrated machinery, utilities and warehousing, alongside working capital, term loans, equity and reserves each year.
The Cash Flow Statement shows cash inflows (equity, term loan drawdowns, operating cash) and outflows (capex, interest, principal repayment, tax, working capital changes). Banks closely review this while assessing rice processing plant loan repayment capacity. Cash flow projections are vital despite profitability reflected in P&L statements, because accounting profit and actual cash generation can diverge substantially.
A standard rice processing plant financial model for project finance also includes working capital assessment, interest calculation, a loan repayment schedule and DSCR computation, plus break-even analysis and profitability ratios such as EBITDA margin, net profit margin, Return on Capital Employed and IRR where relevant. Creating projections for an integrated rice processing plant requires accounting for capital investment across all lines. These projected financial statements are compiled into a bankable project report and CMA Data pack for submission with a bank loan proposal.
Key Assumptions Used in Rice Processing Plant Financial Projections
The quality of integrated rice processing plant financial projections depends entirely on the robustness of assumptions about capacity, product mix, raw materials, selling prices, operating costs and financing. Every assumption must be clearly documented in the DPR and CMA Data.
Plant capacity: Installed capacity should be expressed in TPD/TPA of paddy and product-wise capacity – for example, 150 TPD paddy milling, 60 TPD parboiled, 30 TPD poha, 20 TPD puffed rice. A rice processing plant can have a capacity of 50,000–100,000 MT annually depending on scale. Rice mill installation costs vary based on production capacity – mini rice mills cost around ₹2–3 lakhs to set up, while larger rice processing plants can cost crores to establish. Rice processing plant setup cost varies by scale and technology selected.
Capacity utilization: Capacity utilization in Year 1 typically ranges from 50% to 60%, moving to 70–75% in Year 2 and 80–85% from Year 3 onwards. Assuming 100% utilization from Day 1 is unrealistic and undermines credibility with bankers. Revenue for integrated rice mills generally increases significantly with capacity utilization over the ramp-up period.
Product mix: Projections should segment output between raw rice, parboiled rice, sortexed premium grades, poha, murmura and value-added rice snacks. Margins for packaged retail rice and snacks are higher than for bulk milled rice but require extra packaging, branding and selling expenses. Readers can explore integrated rice processing capacity planning and product mix for deeper technical planning.
Raw material cost: Paddy is typically 75–85% of total raw material costs. Paddy procurement prices significantly influence overall profitability in rice processing. Projections must use realistic seasonal paddy price assumptions mapped to kharif and rabi seasons, MSP trends and state-wise mandi prices. Other raw materials like edible oil or spices for snacks should also be included where relevant.
Yield and recovery ratios: Typical indicative recovery ratios for non-parboiled milling: 67–69% head rice, 8–10% broken rice, 8–10% bran and 18–20% husk. Correct yield assumptions drive both main rice revenue and by-product income.
Selling prices: The model should use separate selling prices for bulk rice, parboiled rice, retail packs (5 kg, 10 kg, 25 kg), institutional supplies, private-label contracts, poha, puffed rice and snacks. Pricing assumptions should align with wholesale and retail benchmarks in the target geography, with modest annual escalation for inflation.
Operating costs: Main cost heads include power and fuel (including boiler fuel for parboiling), labour costs (skilled, unskilled, supervisory), packaging material (bags, BOPP pouches, cartons), repairs and maintenance, transportation costs, quality control, administration and selling & distribution expenses. Paddy rice accounts for 80–85% of operating expenses. Operating costs account for 80–85% of total expenses in rice processing.
Financing assumptions: Typical capital structure includes promoter contribution (equity and permissible unsecured loans), bank term loan, working capital borrowing (cash credit, WCDL), interest rates linked to current MCLR/EBLR, and a repayment period aligned with expected cash accruals to avoid DSCR stress. A 15% to 25% margin is required for term loans depending on the lending institution.
A professional integrated rice plant financial analysis cross-checks all these assumptions against the technical design to ensure internal consistency across every schedule.
Projected Revenue of an Integrated Rice Processing Plant
Revenue must be projected product-wise and grade-wise, not by applying a single average selling price to total paddy throughput. Each processing line – milling, parboiling, poha, puffed rice, snacks – and each packing format carries a different margin profile.
Revenue is calculated as Quantity Produced × Realization for each major product: head rice, parboiled rice, broken rice, branded bags, poha, puffed rice, rice-based snacks and bran. Capacity utilization drives annual production quantities, and seasonal production peaks during post-harvest months should reconcile to annual tonnages.
By-products such as rice bran and husk can contribute 10% to 20% of total revenue. Rice mills can handle diverse by-product streams to maximise profitability – broken rice sold to breweries and snack makers, rice bran for solvent extraction, and husk for captive boiler fuel or sale. Incorporating value-added products like branded rice can enhance revenue potential further.
Assumptions about packaged versus bulk sales – for example, 30–40% share in branded retail packs by Year 4 – can change overall profit margins meaningfully. Readers should study integrated rice products revenue and profitability strategy for deeper guidance.
Projected revenue must be cross-checked against both installed production capacity and realistic market absorption. Over-optimistic sales volume or selling price assumptions commonly lead to bank queries and delays in sanction. Market demand and export demand in the rice market should be validated through proper market research.
Projected Profit and Loss Account
The Projected Profit and Loss Account summarises yearly performance of the integrated rice plant and forms the core of rice processing plant profitability projections used in DPRs and CMA Data. Cost of goods sold in rice processing includes expenses for paddy procurement, utilities and direct processing costs.
The P&L follows this logical structure:
- Sales revenue (main products and by-products)
- Less: Raw material consumption (paddy, other grains, additives)
- Less: Packaging material
- Less: Power and fuel
- Less: Direct labour and factory staff costs
- Less: Factory overheads, repairs and maintenance
- = Gross Profit (gross profit margins for rice processing typically range from 15–25%)
- Less: Salaries, administration expenses, selling and distribution costs, marketing for branded products
- = EBITDA (illustrative range: 10–18% for integrated rice projects under realistic conditions)
- Less: Depreciation on building, machinery, utilities, vehicles
- Less: Interest on term loan and interest on working capital borrowings
- = Profit Before Tax (PBT)
- Less: Tax
- = Profit After Tax (PAT)
Rice mill profit margins typically range from 5–10% in India. Integrated rice processing plants can achieve net profit margins of 5% to 10% after all cost components are accounted for. Initial operational costs are projected to increase significantly by year five due to inflation, maintenance escalation and higher efficiency-related investments. Break-even points for rice processing endeavours are usually achieved by Year 2 or Year 3.
Strong EBITDA alone should not be equated with project success. For bank appraisal, PAT, cash accrual, working capital discipline and DSCR are equally critical.
Working Capital Requirement for Rice Processing Plant
Rice processing plant working capital can be very high because of seasonal paddy procurement, drying, parboiling, ageing of rice, finished goods stocking and distributor credit. Working capital is crucial due to the seasonal nature of paddy procurement. The overall financial model for rice mills should consider cash cycles, working capital, and seasonal influencing factors.
Raw material inventory: Many plants hold 3–6 months of paddy post-harvest to benefit from lower prices, tying up large funds. This single item often forms 60–70% of total working capital requirements. Other raw materials like packaging inputs purchased in bulk must also be considered.
Packing material inventory: Branded BOPP bags, LDPE liners, corrugated cartons and labels are often purchased in sizeable lots. At least 30–60 days of packaging inventory is common and must be reflected in working capital calculations.
Work-in-process (WIP): Parboiling, drying, milling and ageing create WIP – partly processed paddy, semi-processed poha, semi-finished snacks – that may hold 7–20 days of cost value.
Finished goods inventory: Integrated plants often maintain 20–45 days of finished rice stock, and sometimes 30–60 days for branded SKUs. Smaller but frequent stock of poha and puffed rice also needs to be captured.
Receivables: Typical credit periods range from 15–30 days for wholesalers to 30–45 days for large institutional buyers, modern trade and private-label clients. Longer credit for branded products increases receivable levels notably.
Cash and bank balances: Projections should maintain a modest operational buffer – roughly 5–7 days of operating expenses.
Creditors: Supplier credit for paddy, packing materials and consumables (typically 7–30 days) reduces net working capital requirements. Projections must realistically estimate trade credit without assuming excessive creditor days.
Working capital gap and funding: The Working Capital Gap equals Current Assets minus Current Liabilities (other than bank borrowings). This gap is financed partly by promoter margin and partly through bank cash credit or other working capital finance.
For procurement-linked planning, refer to raw material procurement and inventory planning for a rice plant.
Why Paddy Procurement Has a Major Impact on Working Capital
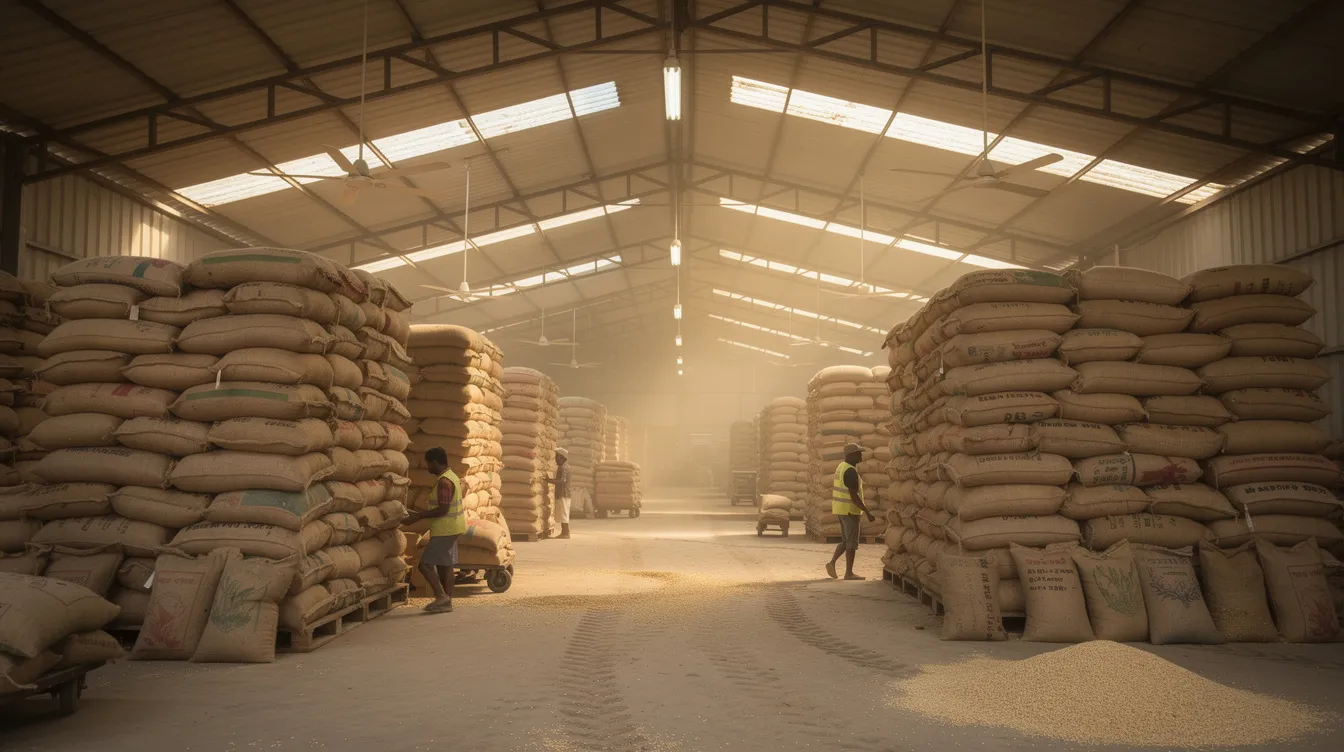
India’s major paddy harvests occur during kharif (October–December) and rabi (February–April) seasons. MSP announcements, local mandi dynamics and quality availability mean that integrated rice plants often buy large quantities during these months to secure a steady supply at favourable prices.
The trade-off is significant: bulk buying at lower paddy prices reduces cost of goods sold and improves gross profit, but locks up funds in inventory, increasing interest cost and storage expenses. This must be reflected in working capital requirement calculations for an integrated rice plant in India.
Storage risks include moisture damage, pest infestation, shrinkage, bagging costs and fumigation needs. Prolonged storage can affect quality and ultimately the selling price realisation.
Procurement strategy – for example, 4 months stocking versus 2 months rolling purchase – should be tested in the integrated rice processing plant financial model to measure its impact on cash flow, DSCR and profit margins. Some plants use warehouse receipts or pledge finance against paddy stocks, which must be modelled as part of working capital finance and fund-based limit assessment.
Working Capital Cycle Example
The working capital cycle represents the timeline from cash outflow on paddy purchase to cash inflow from sales. A simple illustration:
| Component | Days |
|---|---|
| Raw material holding | 60 |
| Work-in-process | 10 |
| Finished goods holding | 25 |
| Receivable collection | 20 |
| Less: Creditor period | (15) |
| Net operating cycle | 100 |
Working Capital Cycle = Raw Material Days + WIP Days + Finished Goods Days + Receivable Days – Creditor Days
A 70–100 day net cycle means the plant needs financing for roughly three months of operating costs at any given time. As an illustrative example, if annual operating cost (excluding depreciation and interest) is ₹80 crore, a 100-day cycle implies a working capital requirement of approximately ₹21.9 crore (₹80 Cr × 100 / 365).
Integrated rice plants with parboiling, ageing and branded packaging usually have longer operating cycles than simple hullers, which must be factored into fund-based limit assessment and DSCR evaluation.
Working Capital Finance and Cash Credit Assessment
Banks in India assess rice processing plant working capital finance based on projected levels of current assets and current liabilities, though each bank applies its own internal policies. Indian Bank, for instance, applies margins of 20–25% on stocks and 25% on book debts for agro mills, though these vary by institution and exposure size.
The assessment involves valuing inventory and receivables at accepted levels, subtracting acceptable creditors and other current liabilities to calculate the Working Capital Gap, which is partly funded by borrower margin and partly by bank cash credit or overdraft.
Cash credit limit proposals are supported by CMA Data – projected P&L, Balance Sheet, fund flow and MPBF working. CA Manish Gugliya assists promoters in preparing such data sets for integrated rice plants. Banks may assess limits under turnover or balance sheet methods depending on the exposure size and their internal guidelines.
Delays in receivables, higher-than-planned inventory or lower-than-expected creditors can increase actual working capital usage beyond projections, putting pressure on utilisation of limits, interest costs and DSCR.
Term Loan and Means of Finance
The overall funding structure of an integrated rice plant covers capital expenditure on land, building, integrated machinery, utilities, warehousing, packaging lines and initial working capital margin, financed through a mix of promoter funds and bank finance.
Project cost elements include land development, civil construction costs, machinery and equipment, electrical and utilities, warehouse and silos, material handling, pre-operative expenses, contingency and margin for working capital. Project cost and means of finance must balance in the rice processing plant project report.
Typical means of finance include:
- Promoter’s equity contribution
- Promoter unsecured loans (to the extent acceptable to the bank)
- Term loans from banks – SBI offers the Rice Mill Plus loan scheme for financing rice mills, and loans under this scheme have no upper ceiling
- Working capital limits
- Government subsidies or grant components where eligible
- Occasionally quasi-equity instruments
For a granular breakup, refer to integrated rice plant project cost and means of finance. Banks evaluate promoter contribution, ability to bring margin money, collateral security and past track record while deciding term loan assessment and sanction levels.
Term Loan Repayment Schedule
The term loan repayment schedule is a year-wise plan of principal repayments, interest and outstanding balance, typically spanning 6–10 years for medium-to-large integrated rice plants, including an initial moratorium period. TMB offers rice mill term loans with repayment up to 84 months and a holiday period up to 12 months.
Key components include the moratorium period (typically 12–18 months post first disbursement), repayment tenure, equal versus structured instalments and treatment of Interest During Construction where applicable.
Illustrative Example – ₹20 Crore Term Loan:
| Year | Opening Balance (₹ Cr) | Principal (₹ Cr) | Interest @12% (₹ Cr) | Closing Balance (₹ Cr) |
|---|---|---|---|---|
| 1 (Moratorium) | 20.00 | 0.00 | 2.40 | 20.00 |
| 2 | 20.00 | 2.86 | 2.40 | 17.14 |
| 3 | 17.14 | 2.86 | 2.06 | 14.28 |
| 4 | 14.28 | 2.86 | 1.71 | 11.42 |
| 5 | 11.42 | 2.86 | 1.37 | 8.56 |
Figures are purely illustrative. Actual terms depend on the lending institution and project specifics.
Excessively aggressive repayment assumptions (large instalments in early years) can cause stress on DSCR even if the project looks profitable on paper.
What Is DSCR in a Rice Processing Plant Project?
The Debt Service Coverage Ratio (DSCR) measures how comfortably a project’s cash accruals can cover scheduled term loan principal and interest obligations in a given period. The debt service coverage ratio for banks commonly targets above 1.2 to 1.5, though each institution applies its own benchmark.
DSCR = Cash Accrual Available for Debt Service ÷ Total Debt Service
Cash Accrual is generally computed as PAT + Depreciation + Interest on term loan (since interest is part of debt service, it is added back to arrive at cash available before debt service). Total Debt Service covers all scheduled term loan principal repayments plus corresponding interest for the period.
Central Bank of India stipulates a minimum average DSCR of 1.25 for rice mill cluster financing, but different banks may set different thresholds. DSCR is a central indicator in term loan assessment and is evaluated alongside project viability, collateral, promoter background and sensitivity analysis.
Rice Processing Plant DSCR Calculation – Illustrative Example
The following example walks through a DSCR calculation for one year using round figures. All numbers are illustrative only and do not represent a recommendation or guarantee.
Year 3 Example (Medium Integrated Plant, ~75% Capacity Utilization):
| Component | Amount (₹ Lakh) |
|---|---|
| Profit After Tax (PAT) | 180 |
| Add: Depreciation | 150 |
| Add: Interest on Term Loan | 206 |
| Cash Accrual Available for Debt Service | 536 |
| Principal Instalment | 286 |
| Interest on Term Loan | 206 |
| Total Debt Service | 492 |
| DSCR | 1.09 |
In this illustrative scenario, Year 3 DSCR is tight at 1.09 – barely above 1.0. This would concern most lenders. In early years, lower capacity utilisation and higher interest produce weaker DSCR. By Year 5–6, as principal reduces and profits stabilise, DSCR typically improves to 1.5 or higher. Return on investment for a rice mill requires careful financial forecasting across all such years.

Average DSCR vs Year-Wise DSCR
Many promoters focus only on average DSCR across the loan tenure, but lenders increasingly examine year-wise DSCR and minimum DSCR to identify potential stress years.
Initial ramp-up years may show lower DSCR because capacity utilisation is lower and interest burden is high. Mid-tenure years often see the tightest DSCR due to peak instalments. Later years generally show comfortable DSCR once principal has reduced.
Rice processing plant DSCR calculations should be presented year-wise in the DPR and CMA Data, with specific attention to any year where DSCR falls close to or below the bank’s comfort level. This may trigger restructuring of repayment or additional promoter support. Promoters should not rely on an inflated average DSCR created by assuming unrealistically high profits in later years to offset weak early years.
Factors That Can Reduce DSCR
DSCR is sensitive to both operational performance and financing terms. Major factors that can weaken DSCR include:
- Lower capacity utilisation than planned – for example, 50% instead of 70% – due to commissioning delays or market constraints
- Delayed start-up of value-added lines like sortex, poha or snacks, which hurts contribution and cash accrual
- Higher paddy prices without corresponding increases in rice selling price, or price volatility compressing margins
- Weak by-product realization for bran and husk, or oversupply-driven competition in the local rice market
- Operational cost escalations: higher power tariffs, increased fuel cost for boilers, unexpected maintenance, higher labour expenses
- Excessive debt relative to equity, higher interest rates than assumed, or a shorter repayment period leading to heavy instalments
- Additional working capital borrowing due to underestimation of inventory and receivables
- Slower collections and overdue receivables squeezing cash flow
Projected Balance Sheet
The projected balance sheet is a year-wise snapshot of the project’s financial position, capturing growth in assets and gradual repayment of liabilities. It is essential for bank finance appraisal and ratio analysis.
Key Asset Heads:
- Land and building (including plant blocks, warehousing, office)
- Plant and machinery (milling, parboiling, poha, puffed rice, packaging, utilities including color sorters and advanced machinery)
- Other fixed assets (vehicles, furniture)
- Inventory (raw materials, WIP, finished goods)
- Trade receivables, cash & bank balances, other current assets
Key Liability and Equity Heads:
- Share capital and promoter equity
- Reserves and surplus (accumulated retained profits)
- Term loan outstanding
- Working capital borrowings (cash credit)
- Creditors and other current liabilities
Yearly profits increase reserves, depreciation reduces the net block of fixed assets, and term loan repayments reduce long-term borrowings – gradually changing ratios like Debt Equity Ratio and Current Ratio over the projection period. The projected Balance Sheet must be internally consistent with P&L and Cash Flow projections.
Cash Flow Statement for Rice Processing Plant
An integrated rice plant may show accounting profits but still face cash shortages if working capital is underestimated or capex is front-loaded without matching inflows. Cash flow projections are vital.
The three segments of cash flow are:
- Operating activities: PAT plus non-cash items (depreciation), adjusted for working capital changes (inventory build-up, receivable changes, creditor changes)
- Investing activities: Capital expenditure on land, building, machinery and utilities
- Financing activities: Term loan drawdown, principal repayment, promoter equity infusion, interest payments
Rapid expansion of branded sales can temporarily increase receivables and inventory, weakening operating cash flows even when P&L margins look healthy. This must be reflected in loan repayment capacity analysis. Financial trajectories for rice processing plants shift from stabilisation to optimised utilisation over five years, and cash flow modelling should capture this evolution.
Impact of Machinery Investment on Financial Projections
Choice of machinery and technology directly influences capital expenditure, depreciation, power consumption (electricity demand), labour requirements, yield and product quality – all of which flow through integrated rice processing plant financial projections.
Higher-end machinery – modern sortex with color sorters, fully automatic parboiling, high-capacity silos and advanced packaging lines – increases initial investment and term loan requirement but can improve yield, reduce labour costs, lower breakage and create premium rice products with better realisations, providing competitive advantage and higher efficiency in the long run.
Machinery configuration affects whether the plant can run poha and puffed rice lines simultaneously with parboiled rice, influencing both production and working capital requirements (more SKUs mean higher packaging and finished goods inventory). An integrated rice mill’s operational efficiency can affect gross profit margins over time depending on the technology deployed.
Maintenance costs should be modelled consistently with machinery type. Underestimating these can distort rice processing plant financial feasibility results. For detailed guidance, see integrated rice plant machinery and equipment cost.
Impact of Land, Building and Layout on Project Finance
Land, building and layout decisions influence both project cost and operational efficiency, affecting term loan size, collateral security value and long-term operating margins. How much land is needed depends on the scale of operations and future expansion plans.
Key built-up components include production blocks (milling, parboiling, value-added products), raw material storage godowns, paddy drying yards, silos, finished goods warehouses, utility areas (boiler house, DG sets, water treatment), administrative building and future expansion space.
Over-investment in non-productive civil structures increases construction costs without proportionate revenue benefits, weakening financial feasibility and DSCR. Under-investment in warehouses leads to higher external storage costs and quality issues. Finding the best location balances land cost, proximity to paddy markets, transportation networks and access to target markets.
For layout planning, refer to integrated rice processing plant land, building and layout. Clear documentation of land and building costs with proper title and approvals is important from a bank finance and collateral security perspective.
Utilities, Warehousing and Packaging Costs
Utilities and support infrastructure significantly influence both project cost (capex) and recurring operational costs (opex) in the integrated rice plant financial analysis.
- Utilities: Electrical power demand (connected load and contract demand), boiler and fuel system for parboiling, water supply and treatment, compressed air and backup power (DG sets)
- Warehousing and material handling: Cost of constructing or leasing warehouses, conveyors, bucket elevators, forklifts, stackers, silos and racking systems
- Packaging systems: Weighing and bagging machines, form-fill-seal machines, vacuum packers, inkjet printers, strapping and shrink-wrapping – packaging material cost is a major item for branded retail packs
Each of these items must appear as both capex and operating expenses in projections. For comprehensive coverage, see utilities, warehousing, packaging and material handling for an integrated rice plant.
Sensitivity Analysis for Financial Projections
A robust rice processing plant financial model must test “what-if” scenarios because real-life performance rarely matches a single forecast.
Key sensitivities to test:
- Paddy price increase (+5% to +10%): Impact on gross profit, PAT and DSCR when selling prices cannot be increased proportionally. Price volatility is a constant risk in paddy procurement.
- Selling price reduction or weaker by-product realization: Particularly when export demand or local demand softens
- Capacity utilisation 10–15 percentage points lower than planned: Common during commissioning delays or market-building phases
- Power and fuel escalation: Rising electricity tariffs and boiler fuel costs
- Higher interest rates or delayed subsidy receipt: Impact on cash outflows and DSCR
- Longer receivable days or higher paddy stocking: Increased working capital requirement squeezing cash flow
Operational costs increase significantly by the fifth year of operation due to inflation, equipment ageing and scale-related expansion. Each sensitivity scenario’s impact on EBITDA, PAT, cash flow, working capital and DSCR should be documented for bank appraisal.
Financial Ratios to Review
Beyond P&L and DSCR, bankers and promoters should review key ratios derived from projected financial statements:
| Ratio | Practical Significance |
|---|---|
| Current Ratio | Measures working capital liquidity – important given large inventory in rice processing |
| Debt Equity Ratio | Leverage indicator influencing bank comfort for extending bank finance |
| TOL/TNW | Total outside liabilities vs. tangible net worth – supplementary leverage measure |
| Interest Coverage Ratio | EBIT ÷ Interest – shows ability to meet interest obligations |
| DSCR | Covers both principal and interest – the primary debt servicing metric |
| EBITDA Margin | Operating profitability before financing and depreciation |
| Net Profit Margin | Bottom-line efficiency – typically 5–10% for integrated rice plants |
| ROCE | Return on Capital Employed – measures efficiency of total capital deployment |
| ROE | Return on Equity – relevant for promoters and investors |
| Working Capital Turnover | Sales ÷ Net Working Capital – efficiency of inventory and receivables |
A healthy integrated rice processing plant may maintain an internal rate of return between 19% and 35% depending on scale, product mix and market positioning. Payback periods for rice processing plants are often between 3 to 5 years.
Financial Projections for DPR and Bank Loan Appraisal
The complete set of financial projections – projected P&L, Balance Sheet, Cash Flow, working capital calculations, DSCR and ratios – is integrated into a Detailed Project Report and CMA Data for submission with a rice processing plant bank loan application.
Bankers evaluate internal consistency: whether project cost tallies with machinery and building details, whether production capacity supports projected sales, and whether raw material requirements match market availability and procurement strategy. Lenders compare projected margins and costs with industry benchmarks and challenge overly optimistic assumptions during appraisal.
A well-prepared rice processing plant bankable project report, with realistic financial projections and clear explanation of working capital and DSCR, improves the quality of discussions with bankers – though it does not guarantee sanction. Project Report Bank, under CA Manish Gugliya, specialises in integrating technical details, cost components, regulatory requirements and financials into a cohesive, bank-acceptable DPR and CMA Data set.
Common Mistakes in Rice Plant Financial Projections
Many rice plant proposals are delayed or rejected not because the business is fundamentally unviable, but because projections are copied, inconsistent or unrealistic. Frequent errors include:
- Assuming 100% capacity utilisation from Year 1 and mixing installed capacity with actual annual production
- Over-optimistic selling price assumptions ignoring local competition and product positioning
- Underestimating or overestimating by-product income from broken rice, bran and husk
- Modelling only 30 days paddy stock when the business plan actually needs 90–120 days, ignoring seasonal spikes
- Ignoring receivable days (assuming all sales are cash), under-budgeting power and fuel costs, or excluding adequate packaging and marketing expenses for branded products
- Using unrealistically long repayment periods inconsistent with bank norms
- Presenting an attractive average DSCR while individual years fall below comfortable levels
- Pasting projections from unrelated rice mill projects without adjusting for different capacities, technologies, locations and product mixes
- Ignoring GST timing, input tax credits and statutory dues that impact short-term cash flows
Integrated Rice Processing Plant Financial Model – Practical Approach
A good integrated rice processing plant financial model follows a logical, step-by-step build-up from technical configuration to DSCR, ensuring each schedule links correctly:
- Finalise processing lines and technical parameters
- Determine installed capacities in TPD for each line
- Estimate realistic capacity utilisation year-wise
- Prepare yield and recovery ratios for rice and by-products
- Estimate product-wise sales volumes
- Apply product-wise prices to forecast revenue
- Compute raw material consumption and cost
- Compile manufacturing and operating expenses
- Determine detailed project cost
- Finalise means of finance and financing structure
- Perform working capital assessment
- Prepare projected P&L
- Prepare projected balance sheets
- Prepare cash flow and fund flow statements
- Structure term loan repayment schedule
- Calculate year-wise and average DSCR
- Run sensitivity analysis on key assumptions
- Review ratios and validate against technical capacity and market data
The model should be built in a flexible spreadsheet with clear input sheets, calculation sheets and output reports. Promoters not comfortable with detailed financial modelling can use a professionally prepared financial model template customised by CA Manish Gugliya and Project Report Bank for their specific project, aligned with their business goals and planning requirements.
Role of a Professional DPR and Financial Projection
Integrated rice plants with multiple product lines and complex working capital cycles benefit greatly from a professionally prepared DPR and financial projections, especially when approaching banks or investors for large term loans and working capital limits in the food processing sector.
A practising Chartered Accountant like CA Manish Gugliya coordinates with technical consultants, machinery suppliers and promoters to translate technical parameters – capacity, product mix, utilities, layout – into bankable financial projections, CMA Data and DSCR analysis. Project Report Bank provides services including Detailed Project Reports, bank finance DPRs, projected financial statements, working capital assessment, DSCR and repayment analysis, and investor-ready integrated rice plant financial analysis reports.
Professional assistance improves the quality and credibility of documentation submitted to banks, but it does not guarantee loan sanction, subsidy approval or specific profit margins. Customised projections built around the promoter’s own capacity, location, business plan and risk appetite are far superior to generic templates when facing detailed appraisal by bank credit teams. This applies whether the unit is small scale or a large-scale integrated processing plant.
Conclusion
The financial success of an integrated rice processing plant depends on a combination of realistic capacity utilisation, carefully chosen product mix, disciplined paddy procurement, correctly sized working capital, sound term loan structuring and sustainable DSCR – rather than on optimistic profit margins alone. Long term success requires continuous attention to efficiency, operations and market positioning.
Financial projections for integrated rice processing plants in India must be tailored to each project’s size, location, raw material availability, target market and financing pattern. They should never be copied from generic rice mill project reports or third-party examples. The difference between a bankable proposal and a rejected one often lies in the realism and internal consistency of these projections.
CA Manish Gugliya and ProjectReportBank.com support entrepreneurs, MSMEs and existing rice processors in preparing integrated rice processing plant project reports, financial projections, working capital and DSCR analysis suitable for submission to banks, financial institutions and potential investors. Promoters who invest time in robust, realistic modelling and documentation are better positioned to negotiate bank terms, manage risks and build a sustainable integrated rice business over the long run.
Frequently Asked Questions
How many years of financial projections do banks usually expect for an integrated rice processing plant?
Most banks in India typically ask for 5–7 years of projected financial statements (P&L, Balance Sheet, Cash Flow) for medium-to-large integrated rice plants, covering at least the full tenure of the proposed term loan. Projections should start from the first full year of commercial operations, with a clear note on the construction period, and must show capacity ramp-up, working capital build-up and DSCR throughout the loan period.
When repayment tenure extends beyond 7 years, some lenders may still accept 7-year detailed projections plus a brief note on performance beyond that horizon.
Can projected financials for a rice mill be reused for an integrated rice processing project?
Simple rice mill projections are not adequate for an integrated project with parboiled rice, poha, puffed rice, snacks and branded packaging, because product mix, operating costs, capital expenditure and working capital cycles are very different. While some base assumptions like broad paddy recovery ratios may be similar, integrated plants need additional schedules for value-added lines, packaging, marketing expenses and by-product utilisation.
Banks may question credibility if they see generic rice mill projections that clearly do not match the proposed integrated setup. A fresh integrated rice processing plant financial projections model should always be created.
How should government subsidies be treated in the rice plant financial model?
Treatment depends on the specific scheme – capital subsidy may be shown either as a reduction from project cost or as a separate capital reserve, while interest subsidy reduces the effective interest outflow. Promoters should avoid assuming subsidies as guaranteed. The recommended approach is to model a base case without subsidy and a second scenario where subsidy is received within a reasonable timeframe, clearly disclosed in the DPR. Eligibility criteria vary by scheme, and promoters should consult their CA for scheme-specific accounting and tax implications.
Necessary licenses for operations also need attention: register for a factory license from the Department of Labour, obtain a No Objection Certificate from the State Pollution Control Board, acquire a license from the Food Safety and Standards Authority of India (FSSAI), register for Goods and Services Tax if turnover exceeds the exemption limit, and register under the MSME category for government benefits and government subsidies access.
What level of detail do banks expect under operational costs for an integrated rice plant?
Banks prefer a reasonably detailed breakup of operational costs covering raw materials, power and fuel, wages and salaries, repairs and maintenance, packing materials, transport, administrative overheads and selling & marketing expenses – especially when value-added and branded products are planned.
For large loans, lenders may ask for further breakdown – separate staff strength and salary assumptions, per-unit power consumption benchmarks – and may compare them to typical norms for similar plants. Transparent, well-explained cost assumptions strengthen credibility and reduce back-and-forth during appraisal.
Is it necessary to engage a professional to prepare rice processing plant financial projections?
There is no legal requirement to hire a professional. Promoters can prepare projections themselves if they have the necessary financial and industry knowledge. However, for integrated plants involving significant capital expenditure, complex working capital cycles and large bank borrowings, professional assistance from a CA or project finance specialist often helps in building accurate, internally consistent models and in presenting data in the format banks expect.
CA Manish Gugliya and Project Report Bank regularly support entrepreneurs and MSMEs with customised integrated rice processing plant financial projections, DPRs and CMA Data tailored to their specific projects across India through dedicated services and funding advisory.