
Key Takeaways
- Capacity planning for a value-added dairy plant is fundamentally a business-financial decision, not merely an engineering one. It must balance assured milk procurement, market demand, product shelf life, machinery configuration, cold-chain infrastructure and working capital availability.
- Optimum capacity and product mix must be decided together in the Detailed Project Report (DPR). Treating them as separate decisions leads to mismatched equipment, idle capacity and poor financial returns.
- Wrong capacity selection directly results in poor capacity utilization, higher fixed cost per litre of milk processed, weak DSCR and difficulty in servicing term loans, making the project unattractive to lenders.
- This article is targeted at industrial-scale value-added dairy projects in the ₹10 crore and above range, focusing on products like paneer, curd, yogurt, Greek yogurt, lassi and probiotic dairy products rather than small cottage units.
- Later sections cover illustrative examples, seasonal product mix strategies, machinery bottleneck analysis, financial projections and what lenders expect to see in a bankable dairy processing plant DPR.
Introduction: Why Capacity & Product Mix Decide the Fate of a Value-Added Dairy Project
When promoters approach me with a dairy project idea, their first question is almost always about capacity: “Should I set up a 50,000 LPD plant or a 1 lakh LPD plant?” The reality is that value-added dairy plant capacity planning is far more nuanced than selecting a number. It requires matching assured milk procurement with real market demand, accounting for the short shelf life of fermented products, designing adequate cold-chain capability, and ensuring the entire system can be financed and serviced through term loan repayments.
What makes dairy processing plant capacity planning uniquely challenging is that the same raw milk can be diverted into paneer, curd, yogurt, Greek yogurt, probiotic products, lassi, buttermilk, flavoured dairy beverages or cream. Each product has different conversion ratios, different packaging requirements, different shelf lives and different contribution margins. The value-added dairy product mix you choose fundamentally reshapes your project cost, working capital, revenue and profitability.
This article approaches dairy plant capacity and product mix analysis from the perspective of project finance and bankability, covering:
- How to determine installed, achievable and product-specific capacity
- Why product mix planning is inseparable from capacity decisions
- How seasonal milk availability and market demand interact
- What machinery bottlenecks actually limit your output
- How capacity and product mix flow into DSCR, working capital and DPR projections
What Is Value-Added Dairy Plant Capacity Planning?
Value-added dairy plant capacity planning is the process of determining how much raw milk a plant should receive, process and convert into finished products on a daily and annual basis, while maintaining commercial viability.
Several distinct capacity metrics matter for a DPR:
- Milk reception capacity: The maximum litres of raw milk that can be unloaded and chilled per day. This must match or exceed peak-day procurement.
- Milk processing capacity: Throughput through pasteurisation, homogenisation and standardisation, usually expressed in litres per hour.
- Installed/rated capacity: The theoretical maximum output based on machinery specifications under ideal conditions, without factoring in downtime or cleaning.
- Achievable/practical capacity: What is realistically possible after accounting for CIP cycles, changeovers, maintenance and seasonal lean periods. Effective capacity includes considerations for sanitation and equipment downtime, typically 70–90% of rated capacity.
- Product-specific capacity: Output in kg or litres of each finished product per day, considering conversion ratios and yield calculations.
- Peak vs. average capacity: The plant must handle flush-season volumes, but annual financials depend on average throughput.
Quick illustration: If a plant has a raw milk intake of 1,00,000 litres per day and allocates 15% to paneer (at ~20% yield from buffalo milk), the paneer line must handle approximately 15,000 litres of milk and produce roughly 3,000 kg of paneer daily. The same logic applies product by product, and the sum of all product lines must reconcile with total milk received.

Why Capacity Planning Is Critical for Dairy Project Viability
Dairy plants require alignment of processing capacity with market demand to prevent waste. Getting this wrong has severe financial consequences:
- Over-sized plants lead to underutilized machinery, excessive depreciation and interest burden, high fixed cost per unit and depressed EBITDA. Across many milk processing plants in India, average capacity utilisation tends to be only 60–70%, often because plants were designed for peak volumes that rarely sustain throughout the year.
- Under-sized or poorly designed plants cannot handle peak-season milk, miss institutional orders and cap revenue growth.
- Mismatched sections (say, adequate pasteuriser but undersized packaging line) create internal bottlenecks that waste time, energy and processed milk.
- Short-shelf-life products like curd and yogurt that remain unsold become write-offs, locking working capital in expired inventory.
Lenders carefully examine capacity utilization projections in the DPR to assess term loan eligibility. A plant showing 95% utilisation from Day 1 is not credible. A plant showing chronically low utilisation signals poor DSCR and repayment risk.
Key Factors for Deciding Dairy Plant Capacity
The optimum installed capacity is always determined by the weakest link in the chain: procurement, processing, packaging, cold storage or market off-take. For industrial value-added dairy plants, planners must balance daily milk availability patterns, seasonal demand spikes, regulatory requirements around food safety and quality standards, and distribution logistics.
Milk Procurement Availability
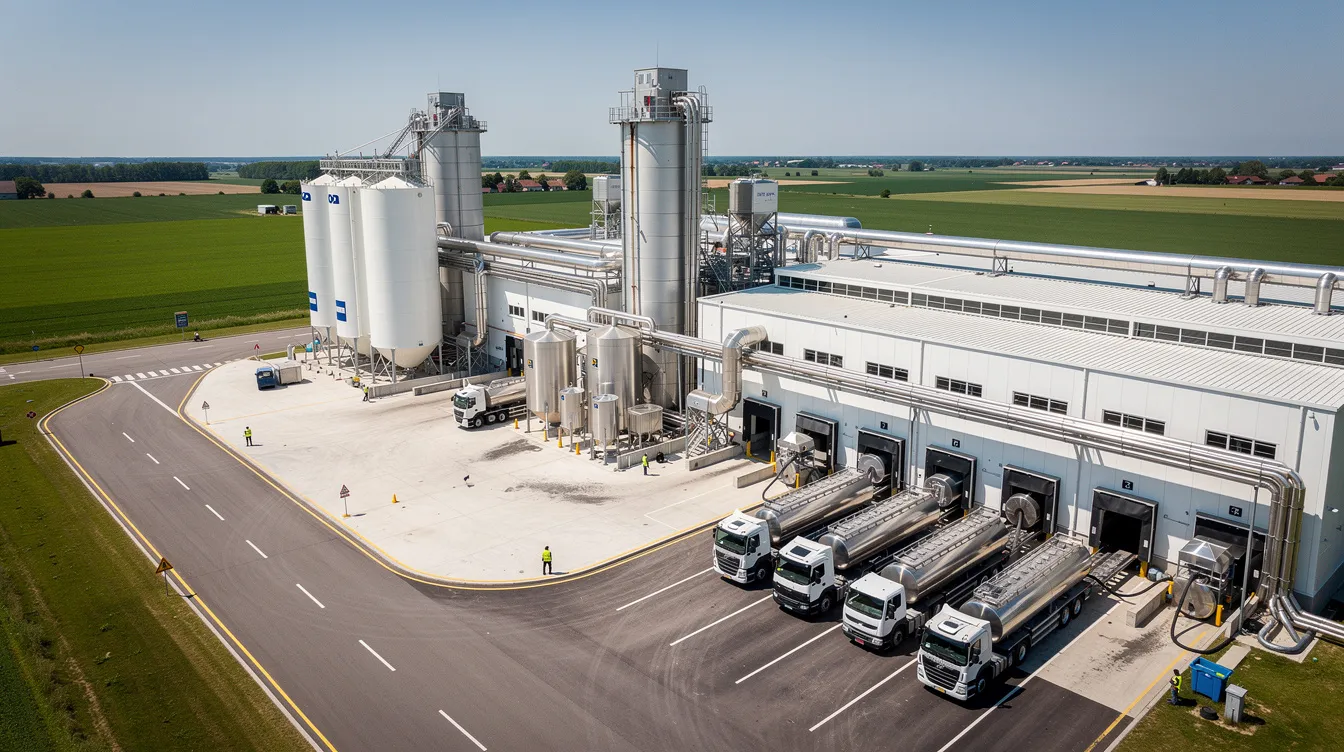
Capacity planning in value-added dairy plants is complex due to fluctuating raw milk supplies. Milk supply fluctuates seasonally: the flush season (roughly October to February) contributes approximately 70% of annual supply, while the lean season accounts for the remaining 30%. The flush-to-lean ratio can range from 1.5:1 to as high as 4:1 depending on the state and climate.
This milk supply variability complicates production planning in dairy. Key procurement factors include:
- Catchment area: Raw milk should ideally come from within a 30–80 km radius to minimise transport time and spoilage. Longer distances require bulk chilling centres.
- Seasonal gaps: Lean-season procurement can drop 30–50% below peak. Plant design should not be based solely on flush-season milk availability.
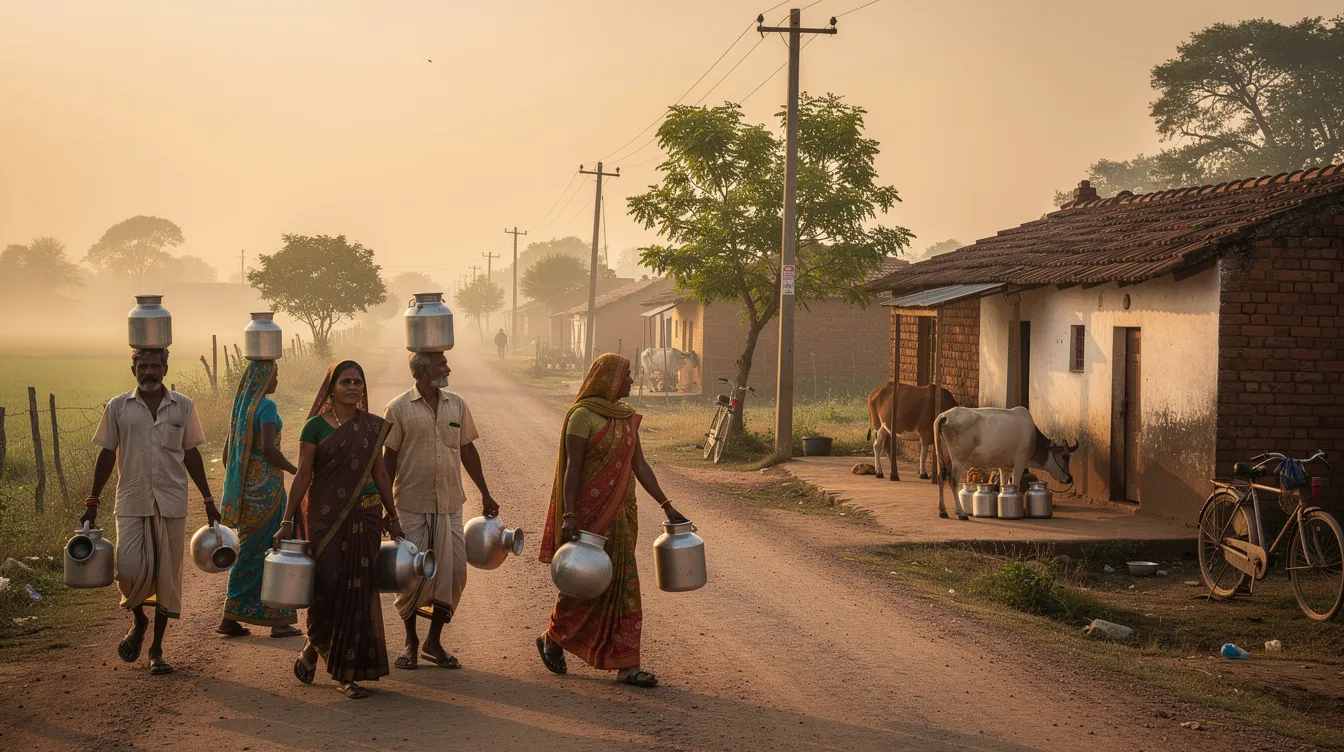
- Collection infrastructure: Village-level milk collection centres, bulk coolers and chilling tanks are essential for supply smoothing and quality preservation.
- Milk quality: Fat and SNF levels, bacterial counts and adulteration risks directly affect product yields and suitability. Quality variations in milk affect yield and product suitability across all product lines.
- Procurement contracts: Tie-ups with cooperatives, farmer producer organisations or contract farming arrangements help ensure reliable supply.
Promoters should plan capacity on realistic average assured milk volume, typically 70–80% of peak availability, rather than optimistic theoretical figures.
Market Demand Assessment for Value-Added Dairy Products
Consumer market research is essential for identifying potential customers before committing to specific production lines. Demand forecasting uncertainty leads to overproduction or stockouts, both of which destroy margins.
- Differentiate between local city retail demand, regional distribution, modern trade, e-commerce and institutional demand from hotels, restaurants, caterers, QSRs, sweet manufacturers and food processors.
- Carry out product-wise demand mapping for paneer, curd, yogurt, Greek yogurt, probiotic beverages and lassi rather than assuming uniform acceptance.
- Assess price-point sensitivity, competition from local dairies and national brands, and brand positioning (mass-market vs premium).
- Align production planning for paneer, curd, yogurt and lassi with realistic daily off-take numbers, factoring in cold-chain limitations.
According to an EY report on India’s dairy sector, flavoured milk is growing at ~20.7% CAGR and western-style yogurt at ~19.7%, signalling strong demand shifts toward value-added segments.
Product Shelf Life, Food Safety & Capacity Implications
Dairy products require specific temperature and shelf-life management to reduce spoilage. Value-added products have varying shelf-lives and maturation timelines, which directly drive production scheduling and inventory policy.
- Fresh curd and yogurt typically have 7–15 days of shelf life under proper refrigeration (2–8°C). Paneer lasts 7–10 days in standard retail packs, longer with vacuum or MAP packaging.
- Dairy products have a short shelf life, increasing planning pressure toward just-in-time production, accurate demand forecasting and tight coordination between production and sales teams.
- Dairy production planning must comply with strict regulatory standards. Dairy facilities must comply with the Food Safety Modernization Act where applicable, and in India with FSSAI regulations. Facilities must register with the FDA for compliance in export scenarios, and dairy processing requires local dairy foods inspector approval before operations commence.
- Traceability records must be maintained for dairy products. FSMA 204 requires detailed traceability for soft cheeses and similar categories.
- Capacity planning must account for how many days of sales can be held in cold storage without compromising food safety or incurring write-offs.
Sales, Distribution Capability & Refrigerated Storage
Dairy processing depends on continuous refrigeration and utility capacity from the moment milk arrives to the point of consumer purchase.
- Daily dispatch capacity (insulated/refrigerated vehicles, delivery routes, dealer network) must match the plant’s output for curd, yogurt, lassi and other chilled products.
- Finished goods cold rooms should be sized in tonnes of storage and pallet positions for at least 2–3 days of peak production, with FEFO-based finished goods dispatch and expiry management.
- Target distribution radius for chilled SKUs is typically 150–200 km; beyond that, shelf-life losses and logistics costs erode margins.
- Include cold-chain and distribution details in the DPR to demonstrate that manufacturing capacity can actually be sold.
Machinery Configuration, Bottlenecks & Line Design
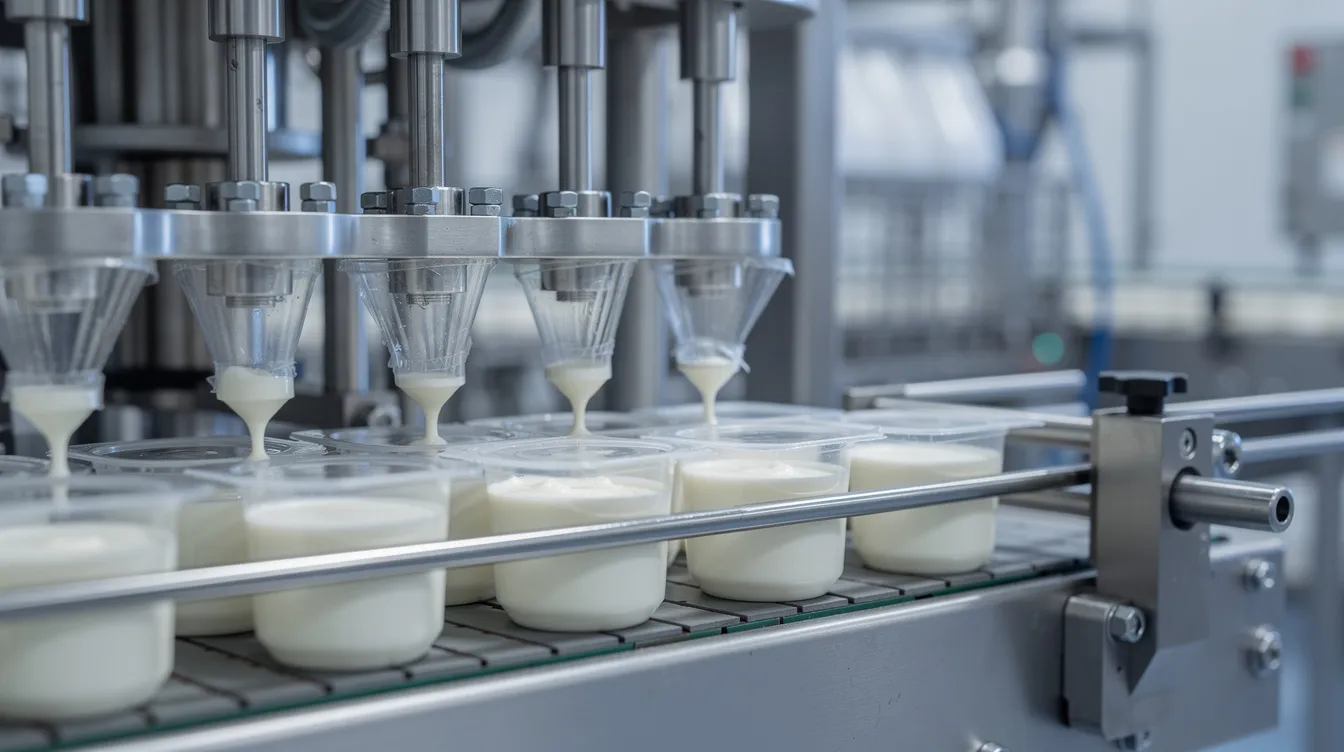
Packing line speed can become a bottleneck in a dairy production process even when upstream pasteuriser capacity is large. Key equipment groups include milk reception docks, storage tanks, pasteurisers, homogenisers, cream separators, fermentation tanks, paneer vats, presses, incubation rooms and various filling machines for cups, pouches and bottles.
- The slowest section restricts total output. A cup-filling line handling 3,000 cups/hour will cap yogurt production regardless of how much milk the pasteuriser can handle.
- Capacity planning must account for mandatory sanitation and cleaning-in-place (CIP) cycles, which can consume 2–4 hours per day.
- Equipment selection and automation level should match projected volumes, labour availability and future expansion plans.
For a detailed understanding of equipment-related capital expenditure, refer to the guide on value-added dairy plant machinery and equipment cost.
Product Mix Planning in a Value-Added Dairy Plant
Dairy plant product mix planning determines what percentage of daily milk goes into each product category. This is not a static decision; it must respond to market conditions, seasonal demand and financial targets.
- Product mix drives realizations, contribution margin per litre, milk solids utilization, machine scheduling and cold storage requirements.
- The mix can shift seasonally: more lassi and beverages in summer, more paneer and curd during festival periods. Flexibility is essential.
- Product mix directly influences working capital, gross contribution and DSCR, so it must be modelled carefully in financial projections within the DPR.
Major Value-Added Dairy Products in the Product Mix
The following products are illustrative and can be customised based on regional demand. Each sub-section highlights capacity and profitability aspects relevant to dairy plant production planning.
Paneer
Paneer is a high-volume value-added dairy product with strong institutional demand from hotels, restaurants, caterers and sweet manufacturers. Buffalo milk yields approximately 21–23% paneer (at 51–54% moisture), while cow milk yields about 17–18%. Small changes in yield assumptions materially impact capacity calculations and profitability projections.
Paneer vats, presses, chilling tanks and cutting/packaging sections must be sized carefully, as they frequently become bottlenecks. For detailed feasibility guidance, see the Industrial Paneer Manufacturing Plant Project Report.
Curd / Dahi
Packaged curd is a primary product in Indian diets with a roughly 1:1 input-output ratio by weight. It requires dedicated fermentation rooms, incubation racks and controlled temperature management. Cup curd commands approximately 2.5× the per-litre price of pouch curd, making packaging format a critical pricing decision.
Even moderate overproduction quickly becomes waste due to the short shelf life. Production scheduling must closely track daily sales data and market demand. Learn more in the Curd / Dahi Manufacturing Plant Project Report.
Industrial Yogurt
Set and stirred yogurt differ from basic curd in formulation, texture expectations and market positioning. Flavour variants, sugar levels and cup sizes increase SKU complexity and changeover time. Abe Farm’s drinkable yogurt achieved a premium of 5.49 in retail value addition, demonstrating the profit potential of well-positioned yogurt products.
Demand comes from modern retail, organised foodservice and online grocery channels. See the industrial yogurt manufacturing plant project report for detailed planning guidance.
Greek Yogurt
Greek yogurt is a premium, higher-solids product requiring additional concentration or straining capacity and significantly more milk per kg of finished product (1.5–2× or more compared to regular yogurt). This affects value-added dairy plant capacity calculation because more raw material input is consumed for the same output weight.
Premium pricing, urban market focus and health-conscious positioning justify the additional equipment investment in strainers, separators or UF systems. Refer to the Greek Yogurt Manufacturing Plant Project Report.
Probiotic Dairy Products
Probiotic curd, drinks and yogurts represent a specialised premium segment requiring strict food safety protocols, culture management and cold-chain reliability. Volumes may initially be smaller but margins can be better, particularly in metros and Tier-I cities.
Additional quality assurance infrastructure, lab facilities and documentation for live culture counts are necessary. Probiotic lines must be carefully scheduled to avoid cross-contamination and maintain strain integrity. Explore the Probiotic Dairy Products Manufacturing Plant Project Report.
Lassi & Other Dairy Beverages
Plain and flavoured lassi, chaas/buttermilk and flavoured milk drinks are high-volume summer products that influence seasonal product mix planning. Beverage lines can effectively absorb surplus milk during flush season, helping reduce waste while maintaining margins. Seasonal spikes can be managed by converting excess milk into longer shelf-life products or high-volume beverages.
Distribution spans general trade, modern retail, institutions and travel channels. See the industrial lassi manufacturing plant project report for production and feasibility details.
Understanding the Dairy Manufacturing Process Before Freezing Capacity
Raw milk must be processed quickly due to its perishability. Promoters must understand the complete processing flow before finalising capacity and machinery size:
Milk reception → Testing → Chilling/Storage → Standardisation → Pasteurisation → Homogenisation (where required) → Product-specific processing (fermentation, coagulation, straining) → Cooling → Filling/Packaging → Cold storage → Dispatch
Each processing stage imposes time and temperature constraints that determine how much milk can be processed per hour and per shift. Process understanding is essential for realistic production scheduling, CIP scheduling, labour planning and line balancing. For a detailed walkthrough, refer to the article on value-added dairy products manufacturing process.
Illustrative Capacity Planning Example for a 1,00,000 LPD Plant
The following allocation is purely illustrative and not a universal recommendation. Actual allocation depends on market demand, milk composition, machinery configuration and business goals.
| Product | Milk Allocation (%) | Milk Volume (Litres/Day) | Approx. Yield Range | Approx. Daily Output |
|---|---|---|---|---|
| Paneer | 15% | 15,000 | 17–23% | 2,550–3,450 kg |
| Curd / Dahi | 30% | 30,000 | ~1:1 | ~30,000 kg |
| Yogurt | 15% | 15,000 | ~1:1 | ~15,000 kg |
| Greek Yogurt | 10% | 10,000 | ~0.5–0.65:1 | ~5,000–6,500 kg |
| Lassi & Beverages | 20% | 20,000 | ~1:1 (with water/sugar) | ~22,000–25,000 litres |
| Probiotic Products | 10% | 10,000 | Varies | ~8,000–10,000 kg |
Shifting even 10% of milk from curd to paneer changes overall contribution, cold storage requirements and packaging line loading. This is why the DPR must model various product mix scenarios to understand impact on profitability and working capital.
Actual conversion ratios vary with fat content, SNF levels, formulation and target moisture. The DPR should use project-specific technical data validated by the equipment supplier rather than generic figures.
Product Mix Based on Market Positioning
Developing a marketing plan is crucial for a value-added dairy business. The classic 4Ps marketing mix-product, price, promotion and place-must align with the plant’s capacity and product portfolio.
Mass-Market Product Mix
A mass-market mix is dominated by curd, liquid milk, lassi and buttermilk, targeting middle-income consumers through general trade. Capacity planning emphasises higher throughput, robust packaging lines and efficient cold chain rather than extremely high per-unit margins. Institutional liquid milk contracts can stabilise base volumes and improve capacity utilization.
Premium Product Mix
Greek yogurt, probiotic products, premium paneer and flavoured yogurts target urban, health-conscious segments. Abe Farm’s ASO MILK brand is priced significantly higher than competitors, demonstrating that premium positioning works when backed by consistent quality and strong branding. Abe Farm’s annual sales grew from 1.71 million to 5.33 million dollars by 2021 through such a strategy. Premium product mix demands more working capital per litre, which must be incorporated in DPR and DSCR analysis.
Institutional Product Mix
Bulk packs (5 kg paneer blocks, 10–20 kg curd tubs) for hotels, restaurants, caterers, sweet shops and food processors. Institutional sales can stabilise daily plant loading but increase customer concentration risk and receivable days. Contract-based volumes require tighter delivery schedules and stringent consistency requirements.
Retail-Focused Product Mix
Branded cups, pouches and bottles for household consumers. Branding can enhance product value and consumer recognition, but SKU proliferation (multiple flavours and pack sizes) increases changeover time, production costs and the need for dairy ERP software or dairy specific ERP systems for inventory and production planning. Shelf-life-aware inventory management is critical to reduce waste and returns.
Hybrid Product Mix
Many industrial dairy plants operate a hybrid model, combining B2B (bulk paneer, institutional curd) and B2C (branded yogurt, retail lassi) to diversify risk. Operational challenges include line scheduling, packaging format changeovers and reconciling B2B and B2C credit and pricing structures. Modelling multiple product mix scenarios in the DPR is strongly recommended.
Capacity Planning Around Machinery Bottlenecks
The nominal milk intake capacity may be far higher than actual finished-goods capacity if individual machines limit production. Dairy plant production capacity planning must be done machine-wise and product-wise.
| Potential Bottleneck | Typical Issue | Mitigation |
|---|---|---|
| Pasteuriser | Insufficient LPH vs milk intake | Add parallel unit or increase shifts |
| Cup-filling line | Slow fill speed limits yogurt/curd output | Upgrade to higher-speed rotary filler |
| Fermentation tanks | Limited volume for simultaneous batches | Add tanks or stagger batch schedules |
| Paneer vats/presses | Long pressing cycle limits daily batches | Add press capacity or automate |
| Cold rooms | Insufficient pallet positions | Expand cold storage before adding lines |
| CIP system | Long cleaning cycles reduce production time | Install dedicated CIP for each section |
Production Line Balancing & Shifts
Line balancing ensures that upstream and downstream equipment capacities are matched. If a pasteuriser processes 10,000 LPH but the filling line handles only 6,000 LPH, the excess processed milk creates queues, increases chilling holding time and wastes energy.
- One-shift operation (8 hours effective) with 2–3 hours of CIP/changeover provides the simplest scheduling but lowest output.
- Two-shift operations can nearly double output without doubling capital expenditure. Many promoters should consider maximising shifts before investing in additional equipment.
- Rated machine capacity should never be treated as annual saleable production. The DPR must clearly show assumptions for number of shifts, effective operating hours, changeover time and maintenance schedules.
Manual adjustments to production schedules may be needed daily to account for actual milk receipt, equipment status and order changes, though ERP systems and machine learning-based demand forecasting can improve accuracy over time for larger operations.
Realistic Capacity Utilization Assumptions for New Projects
Lenders and investors expect evidence-based utilisation assumptions. Projecting 100% capacity utilization from Year 1 is rarely credible.
| Year | Illustrative Utilisation Range |
|---|---|
| Year 1 | 40–50% |
| Year 2 | 60–70% |
| Year 3+ | 75–85% |
These are only illustrative. Exact assumptions must be justified by procurement tie-ups, brand establishment timelines and market penetration evidence. Over-aggressive projections artificially inflate DSCR and mislead decision-making, while too conservative assumptions understate project viability. Historical data from comparable plants can strengthen credibility.
Seasonal Capacity Planning & Product Mix Flexibility
Seasonal patterns in both milk production and market demand require flexible production scheduling:
- Flush season (Oct–Feb): Surplus milk can be diverted into paneer, longer-shelf-life products or beverages to avoid waste.
- Summer (Mar–Jun): Demand spikes for lassi, buttermilk and flavoured beverages. Packaging and cold-chain capacity must handle peak beverage volumes.
- Festival periods: Institutional demand for paneer and curd rises sharply, requiring short-term inventory build-up.
Equipment and fermentation areas should be flexible enough to support different production schedules in different months. Manual planning or ERP-based scheduling helps plants adapt their product line allocation dynamically.
Product Mix, Contribution & Profitability Analysis
Pricing is often the most challenging aspect of marketing strategy in dairy. The product with the highest selling price is not automatically the most profitable. A basic contribution formula:
Selling Price – Raw Milk Cost – Other Raw Materials – Packaging – Variable Processing Costs – Distribution = Contribution per unit
The Onishi method quantifies value added at each processing stage, while the Hayami method determines value-added ratios for processed products. Cost-based evaluation subtracts raw material costs from sales to find added value. Value addition methods include market-based and quality-based evaluations, and the Onishi method allows for international comparisons of value addition. Abe Farm’s drinkable yogurt had a premium of 4.45 in processing value addition, illustrating how different products generate vastly different margins at each stage. Processing milk into cheese, for instance, increases profit margins by 0.688 euros per liter in European contexts, demonstrating the economics of value addition globally.
For a dairy plant, contribution per bottleneck machine hour (for example, per hour of cup-filling capacity) is an advanced way to select the most profitable product mix. Dairy farmers can enhance profitability through product differentiation and branding rather than simply maximising volume.
| Product | Relative Realisation | Yield Range | Packaging Cost | Approximate Contribution Profile |
|---|---|---|---|---|
| Paneer | High | 17–23% | Moderate (vacuum packs) | Higher per kg, moderate per litre |
| Curd (cup) | Medium-High | ~100% | Higher (cups + lids) | Good per kg, moderate per litre |
| Greek Yogurt | Very High | 50–65% | High (premium cups) | Highest per kg, variable per litre |
| Lassi (pouch) | Medium | ~100%+ | Low (pouches) | Lower per unit, good on volume |
Values are illustrative. Actual contribution depends on procurement cost, pricing decisions, location and scale.
Product Mix, Milk Fat/SNF Optimization & By-Products
Milk composition directly affects product mix decisions. Fat standardisation, cream separation and SNF utilisation across paneer, curd, yogurt and beverages must be planned to maximise value from every litre of raw milk.
- Paneer manufacturing typically needs milk with ~4% fat. Surplus cream can be sold or used for butter and ice cream.
- Skim or standardised milk can be channelled into low-fat beverages, lassi or fermented products.
- Good product mix planning ensures minimal wastage of milk solids and maximises value-added milk products production capacity. The DPR should show clear logic of fat/SNF balance and by-product handling.
Impact of Product Mix on Working Capital
Product mix materially affects working capital requirements:
- Premium and institutional products generally require more credit to customers (higher receivable days) and greater inventory of packaging and ingredients.
- High-rotation products like curd and lassi have lower inventory days but demand frequent replenishment, straining logistics and cold chain.
- Bank CC/OD limits and interest costs must be sized according to realistic working capital projections for the chosen mix.
| Product Category | Typical Inventory Days | Typical Receivable Days | Working Capital Intensity |
|---|---|---|---|
| Mass-market curd/lassi | 2–4 | 7–15 | Moderate |
| Premium yogurt/Greek yogurt | 3–7 | 15–30 | Higher |
| Institutional paneer/curd | 2–5 | 21–45 | High (receivable-driven) |
Illustrative ranges. Actual figures depend on distribution channels and credit terms.
Impact of Product Mix on Project Cost & Machinery Investment
Product mix shapes capital expenditure. Adding Greek yogurt and probiotic lines requires additional fermentation and straining systems, specialised filling machines and stronger lab and quality assurance infrastructure, significantly increasing project cost compared to a simple paneer-curd plant.
Packaging format (cups vs pouches vs bottles) and automation level influence both initial equipment cost and future scalability. Cold rooms, blast chillers, incubation rooms and CIP systems must be sized in line with the intended share of short-shelf-life products. Rising input costs for packaging materials and refrigeration energy also affect long-term operational budgets.
Capacity Planning & Bank Finance DPR Requirements
Lenders expect a dairy processing plant DPR to present capacity and production planning with internal consistency. Key elements include:
- Installed capacity by product, achievable practical capacity, proposed annual production and phased capacity utilization over the projection period.
- Raw milk availability assumptions, procurement cost, product-wise sales volumes and realizations.
- Break-even point, gross contribution, EBITDA, working capital assessment, term loan repayment schedule and year-wise DSCR analysis. Lenders typically expect average DSCR of at least 1.25× or higher.
- Sensitivity analysis on milk cost, selling price, capacity utilisation and product mix composition.
Capacity figures must flow consistently through the technical, production and financial sections. Milk input, product output, sales volume, revenue and cost figures must reconcile across all DPR schedules for bankability. Faster implementation of project milestones also improves lender confidence.
Common Capacity Planning & Product Mix Mistakes
| Common Mistake | Recommended Corrective Approach |
|---|---|
| Designing capacity only for flush-season milk | Plan on average assured supply (70–80% of peak) |
| Assuming 90–100% utilisation from Year 1 | Use phased ramp-up (40–50% in Y1, scaling to 75–85%) |
| Ignoring packaging line bottleneck | Size filling/packing capacity to match pasteuriser output |
| Selecting too many SKUs at launch | Start with 4–6 core SKUs; add flavours after market validation |
| Underestimating cold storage needs | Size cold rooms for at least 2–3 days of peak production |
| Using unrealistic yield assumptions | Validate yields with equipment supplier and pilot trials |
| Focusing on turnover instead of contribution | Analyse contribution per litre and per bottleneck hour |
| Ignoring working capital requirements | Model product-wise working capital cycle in DPR |
| Creating spreadsheet-perfect mixes that are hard to manufacture | Validate production schedules with process engineers |
Framework for Developing the Optimum Capacity & Product Mix
A practical, stepwise approach:
- Estimate assured milk procurement (average and seasonal volumes) from identified catchment areas.
- Map target markets: local retail, regional distribution, institutional buyers, modern trade.
- Forecast product-wise demand based on consumer market research and competitive analysis.
- Decide preliminary product portfolio aligned with business planning and brand strategy.
- Calculate yields and contribution per litre for each product using realistic conversion ratios.
- Identify bottleneck equipment and size each section accordingly.
- Determine packaging requirements (cups, pouches, bottles) and line speeds.
- Estimate working capital for each product and season.
- Simulate seasonal scenarios (flush vs lean, summer vs festival).
- Prepare financial projections: P&L, cash flow, DSCR, break-even.
- Run sensitivity analysis on key variables.
- Finalise installed capacity and plan phased expansion triggers.
There is no universal model. Each project’s optimum mix depends on location, milk cost, competition, brand strategy and financing structure. Promoters should review this framework with both technical consultants and project finance advisors.
Capacity Expansion Strategy for Growing Dairy Plants
Rather than over-investing from Day 1, design the plant for phased expansion:
- Install expandable utility systems (boilers, chillers, compressors) with headroom for 30–50% capacity increase.
- Keep space in processing and packaging halls for future lines and modular tanks.
- Reach higher utilisation on existing equipment by adding shifts, improving production planning and reducing downtime before committing to large fresh capex.
- Build indicative expansion phases and volume triggers into the original DPR.
The balance between maintaining some spare capacity for growth and avoiding excessive idle capacity that depresses returns requires careful judgement. A farm-to-facility approach that scales procurement networks alongside processing capacity tends to deliver better long-term results.
Capacity Planning Considerations for ₹10 Crore+ Value-Added Dairy Projects
At this scale, planning must integrate multi-village procurement networks, multiple product lines, automated packaging, cold-chain logistics and robust food safety and quality systems. Dairy ERP software becomes essential for synchronising raw milk intake, production planning, inventory management, sales orders, sales data analysis and regulatory compliance.
Financial aspects are correspondingly more complex: scale economies exist but so does a higher fixed cost base, stricter lender scrutiny, structured term loans and possible DSRA (Debt Service Reserve Account) requirements. Decision-makers should evaluate alternate capacity and product mix scenarios (for example 1 LLPD vs 2 LLPD) and their impact on project cost, DSCR and profitability before locking in the financing plan. The dairy industry at this scale rewards thorough analysis over speed.
Role of a Professionally Prepared Detailed Project Report (DPR)
A comprehensive DPR ties together all the threads discussed above into one coherent, bankable document:
Technical configuration → Installed capacity → Product-wise output → Sales volumes and prices → Operating costs → EBITDA → Working capital → Cash flows → DSCR → Term loan repayment capacity → Project viability
Lenders and investors rely on DPRs not only to assess profitability but to understand underlying assumptions about milk availability, market demand and capacity utilization. A well-structured value-added dairy plant project report includes scenario and sensitivity analysis on key variables, ensuring that the production system is stress-tested before capital is committed.
As a project finance consultant, I help promoters refine capacity and product mix assumptions to improve the project’s bankability and long-term sustainability, ensuring that engineering ambitions and financial reality remain aligned.
FAQs on Value-Added Dairy Plant Capacity Planning & Product Mix
How is dairy plant capacity calculated in practice?
Start from assured litres of milk per day. Apply realistic utilisation (say 80–90% of theoretical intake after seasonal adjustments). Consider machine-wise hourly capacity and effective operating hours per shift. Convert milk into product-wise outputs using validated yield calculations. Capacity should be expressed both in terms of milk handled per day and annual tonnes or litres of each finished product in the DPR.
What capacity utilisation is realistic for a new value-added dairy plant?
100% utilisation from Year 1 is unrealistic. Most bankable DPRs use phased ramp-up: illustratively 50% in Year 1, 65% in Year 2 and 75–80% by Year 3. Exact figures must be justified by procurement tie-ups and market studies. Lenders prefer conservative yet achievable assumptions that reflect the time needed for brand establishment and market penetration.
Can paneer, curd and yogurt be manufactured in the same dairy processing plant?
Yes. Integrated value-added dairy plants commonly produce multiple various products on shared infrastructure with product-specific sections for fermentation, coagulation and packaging. The DPR must clearly show product-wise allocation of milk, separate capacities, hygiene zoning, scheduling and CIP protocols for each major product line to maintain consistent quality.
How does product mix affect working capital and bank limits?
More premium and institutional products increase receivable days and inventory of inputs and packaging, raising working capital needs. High-rotation mass products tie up less stock but require substantial daily cash for milk procurement. Working capital assessment for bank finance must be done product-wise and season-wise, not as a flat percentage of turnover.
Can the product mix be changed after the dairy plant is commissioned?
Some flexibility is always possible within the limits of installed machinery, packaging formats and cold-chain capacity. Major shifts, such as moving heavily into Greek yogurt or probiotic drinks, may require additional equipment, lab infrastructure and regulatory clearances. Designing the initial plant with reasonable flexibility in tanks, piping and packaging lines allows the product mix to be fine-tuned based on actual market response and sales data without complete re-engineering.
Conclusion & Author Note
Optimum value-added dairy plant capacity is not about installing the largest possible LPD. It is about creating a commercially sustainable balance of assured milk availability, validated market demand, machinery capacity, product yields, packaging capability, cold-chain infrastructure, working capital and financing strength. Every litre of milk must earn its way through the plant.
Integrated dairy plant capacity and product mix analysis must sit at the core of every value-added dairy processing plant DPR and feasibility study. Without this integration, technical assumptions drift from financial reality, and the project becomes difficult to finance and harder to operate profitably.
A well-prepared project report helps promoters and lenders understand capacity, product mix, project cost, profitability, DSCR and risk profile before investing several crores in machinery and civil work. The cost of thorough planning is a fraction of the cost of getting it wrong.
CA Manish Gugliya Chartered Accountant | Project Report & DPR Consultant www.projectreportbank.com