

By CA Manish Gugliya
Key Takeaways
Industrial ice cream plants require substantial capital investment across automated machinery, refrigeration infrastructure, cold storage and distribution logistics. Getting both profitability and cash flow right from the outset is what separates a funded project from a rejected one.
- Ice cream plant financial projections and working capital requirement must be integrated within a single DPR, not prepared in isolation – banks expect internally consistent schedules across all financial statements.
- A plant can show healthy annual profits on paper yet face severe cash crunches during peak summer if inventory build-up and trade receivables are under-funded.
- Realistic capacity utilisation ramp-up, product-wise net selling prices, seasonal demand modelling and cold-chain operating costs form the backbone of a bankable financial model.
- Working capital for ice cream manufacturing business is inherently seasonal – peak funding needs during pre-summer months can be significantly higher than annual averages.
- Professional support from a practising Chartered Accountant helps align projections with lender expectations, reduces appraisal queries and strengthens the overall finance proposal.
Introduction: Why Financial Projections and Working Capital Matter for an Ice Cream Plant
India’s ice cream market is projected to reach ₹30,000 crore and is growing at 13–15% annually. The global ice cream market was valued at USD 78.57 billion in 2025 and is expected to reach USD 102.38 billion by 2034. This consistent growth attracts new entrants, but the journey from concept to commercially successful ice cream production demands rigorous financial planning – not optimistic guesswork.
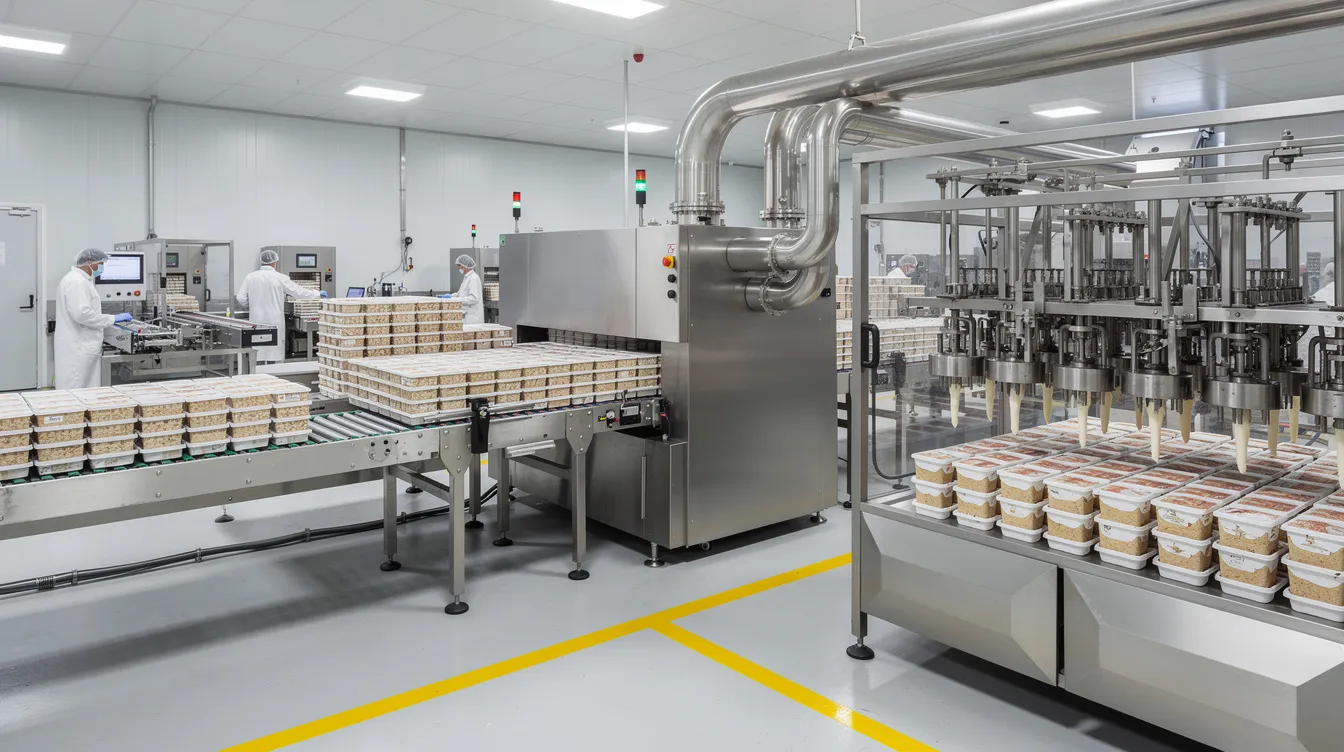
An industrial ice cream manufacturing unit is fundamentally different from a small ice cream shop or a home-based operation. A typical medium or large automated ice cream factory in India involves continuous freezers, hardening tunnels, blast freezing rooms, automatic filling and packing lines, cold storage chambers maintained at minus 25°C or lower, refrigerated vehicles and distributor freezers placed at retail points. Such projects involve total project costs running into several crore – a topic covered in detail in our discussion of ice cream plant project cost and means of finance.
The operating realities of this business are demanding. Power and refrigeration loads remain continuous, cold chain infrastructure must function without interruption, inventory of milk, cream, sugar, flavours, stabilisers and packaging materials must be maintained at appropriate levels, and seasonal demand spikes in Indian summers can push sales volumes to three or four times the lean-season run rate. Add to this the credit extended to distributors, modern retail chains, hotels, restaurants and institutional buyers, and you have a business where strong cash flow management is critical due to seasonal production and sales fluctuations.
Consider two scenarios. A newly commissioned plant begins building inventory weeks before the summer selling season, but distributor payments from the previous month have not yet arrived – leaving the promoter scrambling for funds despite a healthy projected annual profit. In another case, a large modern-trade chain delays payment by 45 days beyond the agreed cycle, and the plant’s cash credit limit is already fully drawn. Both situations illustrate why ice cream plant financial projections and working capital requirement must be planned together, not treated as separate exercises.
This article is part of the Industrial Ice Cream Manufacturing Plant Project Report / DPR topic cluster on www.projectreportbank.com.
Meaning of Financial Projections for an Industrial Ice Cream Plant
Financial projections are structured, assumption-based forecasts that model the expected financial performance and position of an ice cream factory over a defined period – typically five to seven years. They are not rough estimates or simple percentage extrapolations of current figures. Every line item in a well-prepared projection traces back to a documented assumption about capacity, cost, price or market behaviour.
For a greenfield ice cream plant, projections normally include production and capacity-utilisation estimates, product-wise sales projections, raw-material and packaging consumption schedules, manufacturing and operating expenses, and the complete financing structure. A bankable DPR usually contains a projected profit and loss account, projected cash-flow statement, projected balance sheet, working capital assessment, term-loan repayment and interest schedules, and key indicators such as DSCR and break-even volume. Year 1 is typically broken down monthly or quarterly to capture seasonal dynamics, while Years 2 through 5 may be presented annually.
For expansion projects – such as an existing dairy company adding an ice cream line – the projection approach differs because past performance data is available and must be integrated with forward estimates. In either case, assumptions must be consistent with the proposed industrial ice cream manufacturing process and production line and validated against sector benchmarks.
Key Assumptions in Ice Cream Manufacturing Plant Financial Projections
Assumptions are the foundation of every ice cream manufacturing business financial plan. Overly optimistic or poorly documented assumptions will be questioned during bank appraisal and can lead to rejection of the loan proposal or, worse, under-funded operations post-commissioning. The major assumption blocks include installed capacity, capacity utilisation ramp-up, product mix, net selling prices, raw-material consumption norms, packaging cost per unit, seasonality factors, credit terms for customers and suppliers, and operating days per year. Banks and investors scrutinise how these assumptions compare with industry norms, benchmarks of existing ice cream manufacturers and the promoter’s actual distribution strategy.
Installed Production Capacity and Operating Pattern
Installed capacity for industrial plants is usually expressed in litres per hour or litres per day of finished ice cream, directly linked to the selected machinery configuration – continuous freezers, filling lines and hardening capacity. The DPR should specify the rated output per hour, number of shifts (typically one to three), expected operating days per year (commonly 300–330 days) and allowances for downtime, CIP cleaning cycles and product changeovers. Production capacity and utilisation should be accurately modelled based on physical constraints of the plant layout and machinery throughput.
A small ice cream manufacturing unit typically produces around 1,000 litres per day and requires about ₹25 lakh to start, with machinery costs ranging from ₹15 lakh to ₹20 lakh. Monthly earnings for such units range from ₹50,000 to ₹1,00,000. However, the focus of this article is on medium and large plants. As an illustrative example only, a 10,000 LPD plant operating on a single shift of 8 hours for 300 days per year would have an annual rated capacity of 30,00,000 litres. Capacity choices and their cost implications are discussed in our article on automatic ice cream plant machinery and equipment cost.
Capacity Utilisation Ramp-Up
A new factory in the ice cream industry rarely operates at full installed capacity in its first year. Commissioning delays, initial market development, distributor onboarding and consumer acceptance of a new brand all constrain early volumes. An illustrative five-year capacity utilisation schedule (illustrative only) might look like: Year 1 at 45%, Year 2 at 60%, Year 3 at 70%, Year 4 at 80% and Year 5 at 85%. These are not industry standards – actual ramp-up depends entirely on the promoter’s market reach, brand strength and operational readiness. Utilisation assumptions must align with the proposed revenue scale and operating cycle discussed later.
Product Mix and Positioning
Typical industrial ice cream products span several categories: low-unit-price cups, cones and sticks aimed at impulse purchase segments; higher-value family pack and tub formats; bulk HoReCa and institutional packs; party packs for events; and premium lines featuring high quality ingredients such as nuts, premium ingredients or chocolate coatings that can command higher price points. Each category carries different selling prices, packaging costs, gross profit margins and distribution routes. Projections must therefore be built product-wise rather than treating all output as a single blended SKU. Institutional and private-label contracts may deliver lower per-litre realisation but can improve plant capacity utilisation and absorb fixed costs, which is a sound pricing strategy for early years.
Selling Price and Net Realisation
There is an important difference between MRP and the manufacturer’s net realisation. From the printed MRP, one must deduct distributor margin, retailer margin, promotional schemes, trade discounts, GST (GST registration is mandatory for ice cream manufacturing) and expected returns to arrive at the net amount the factory actually receives. As an illustrative example only, an MRP of ₹30 for a stick product might translate into a net manufacturer realisation of around ₹16–₹18 after all deductions. Profit margins for ice cream shops typically range from 12% to 30%, but the manufacturer’s margin structure is different. Price assumptions in five-year projections should incorporate periodic revisions for inflation, value-addition and competitive positioning in the ice cream market.
Seasonality and Monthly Volume Pattern
Ice cream demand is highest in warmer months, with many facilities realising 60–70% of annual ice cream sales in Q2 and Q3. Indian demand peaks during March to June, stays moderate during festive and wedding seasons around October–November, and softens during monsoon and winter. Seasonality significantly affects revenue and cash flow. Serious ice cream plant financial projections must use at least monthly or quarterly seasonality factors for Year 1 instead of assuming uniform sales throughout the year. This seasonality directly affects inventory build-up, finished-goods holding in cold storage, receivable cycles and working capital for ice cream manufacturing business. A detailed treatment of seasonal demand patterns appears in our article on ice cream plant revenue model, distribution network and seasonality.
Production Yield, Losses and Returns
Projections must incorporate realistic yields based on fat content, overrun (the volume increase due to air incorporation that gives ice cream its creamy texture) and recipe formulations – not simply equate milk input to finished litres. Accurate modelling of yields, overrun and wastage is vital for determining financial performance. Typical loss points include mix preparation losses, line losses during flavour changeover, filling variations, carton damage, in-transit melting, expiry and market returns. Assuming roughly 2–3% for process loss and another 1–2% for market returns (illustrative only) is prudent. These losses must be reflected both in cost of goods sold and working capital calculations.
Credit Policy and Collection Period
Credit terms differ across customer segments. General distributors might receive 15–21 days credit, while modern retail chains and institutional buyers such as hotels and caterers may expect 30–45 days (illustrative only). Consumer preferences and bargaining power vary – quick commerce platforms and direct-to-consumer channels may involve different settlement cycles. Optimistic credit assumptions can artificially reduce the ice cream plant working capital requirement on paper and will be challenged by banks during appraisal.
Revenue Projection for an Industrial Ice Cream Manufacturing Plant
Revenue projections for an ice cream facility are based on unit sales and average selling prices, computed SKU-wise or at least product-category-wise for accuracy. The core formula is straightforward:
Projected Revenue = Saleable Production × Product Mix Share × Net Selling Price
It is important to distinguish between production volume, dispatches and recognised sales. Stock pre-built before summer and dispatched in subsequent months may create timing differences between production and revenue recognition.
The following illustrative table (illustrative only) demonstrates revenue projection for a mid-size plant:
| Product Category | Volume Share | Capacity Utilisation (Yr 1) | Saleable Production (Litres) | Net Realisation (₹/Litre) | Projected Revenue (₹ Lakh) |
|---|---|---|---|---|---|
| Cups & Cones | 40% | 45% | 5,40,000 | 95 | 513.00 |
| Sticks & Bars | 25% | 45% | 3,37,500 | 110 | 371.25 |
| Family Pack / Tubs | 20% | 45% | 2,70,000 | 130 | 351.00 |
| Bulk / Institutional | 15% | 45% | 2,02,500 | 80 | 162.00 |
| Total | 100% | 13,50,000 | 1,397.25 |
Based on 30,00,000 litres annual rated capacity. All figures illustrative only.
Export or inter-state sales, if any, may involve different pricing, logistics costs and regulatory compliance requirements.
Projected Operating Cost Structure for an Ice Cream Factory
Manufacturing and operating costs in an ice cream factory span raw materials, packaging, utilities, manpower, distribution, maintenance and overheads. The capital expenditure budget for ice cream manufacturing must include various categories beyond just machinery – civil works, refrigeration infrastructure, quality control labs, DG sets and vehicles all contribute. Detailed cost schedules drive both the projected profit and loss account and the cash flow statement, directly influencing project viability and term-loan appraisal.
Raw Materials and Ingredients
Key raw materials include milk, milk cream, skimmed milk powder (milk solids), sugar, stabilisers, emulsifiers, flavours, colours, fruit preparations, nuts, chocolate, cones and inclusions. India produces over 20 crore tonnes of milk annually, ensuring reliable bulk supply, though dairy farmers’ prices can fluctuate seasonally. Ice cream manufacturing operating costs are 60–70% raw materials, with milk and cream forming the largest component. Raw materials cost approximately ₹5 lakh per month for a small plant, scaling proportionally for larger operations. Sensitivity analysis on raw material costs is essential given price volatility in dairy and sugar markets.
Packaging Material
Packaging materials include printed cups, cones and sleeves, sticks, family tubs, lids, laminates and wrappers, corrugated cartons, labels and secondary packaging. Packaging costs vary based on format and are a significant expense for ice cream producers – small-SKU impulse products can carry disproportionately high packaging cost per litre compared to bulk packs. Branding choices such as multi-colour printing and premium tub designs affect both cost and market positioning.
Power, Refrigeration and Utilities
Continuous refrigeration across pasteurisation, hardening, cold storage and cold-chain logistics drives high electricity consumption. Utilities and energy for refrigeration, freezing and cold storage constitute 8–15% of operating expenses. Key utility heads include electricity for compressors and freezers, chilled-water systems, boiler or hot-water generation, water for CIP cleaning, and diesel for DG sets during power outages. Underestimating these costs – or failing to provide backup power – can cripple margins. Storage infrastructure details are covered in our guide on ice cream cold storage and hardening tunnel requirements.
Employee Cost
Key manpower categories include production operators, quality control and quality inspection staff, engineers and maintenance personnel, stores and cold-room staff, sales and distribution teams, administrative and accounts employees, and senior management. Labor costs should distinguish between fixed salary components and variable sales incentives. Annual increments and statutory benefits must be factored into five-year projections.
Distribution, Cold-Chain and Selling Expenses
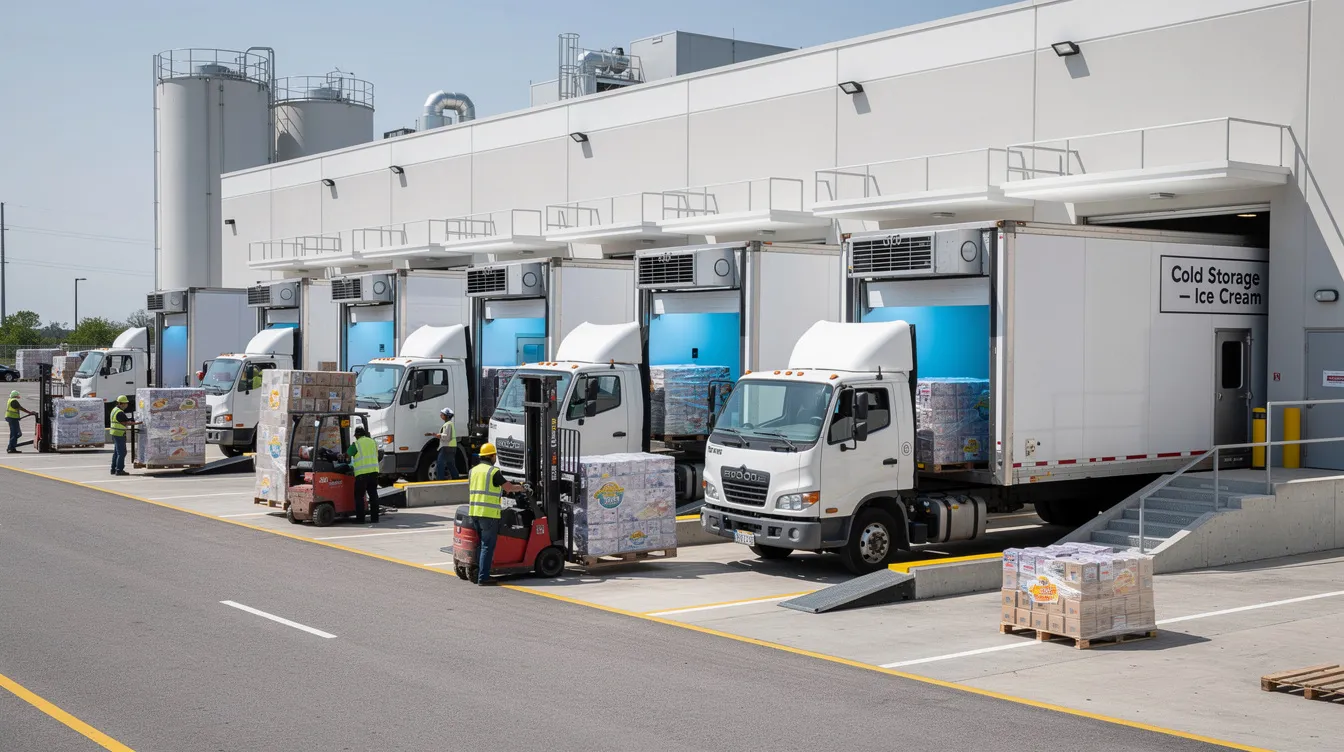
Ice cream manufacturing relies on cold-chain logistics to ensure product quality during distribution. Distribution and logistics impact the economics of ice cream sales and require careful financial modelling. Typical expenses include operation of refrigerated trucks, third-party cold-chain charges, fuel, freight, freezer placement at retail outlets and sales-promotion schemes. Distribution costs in the initial years can be elevated as the brand invests in freezer cabinets at retailer points and launches marketing campaigns targeting its target market and customer segments.
Other Operating and Administrative Overheads
Operating expenses cover administrative costs, marketing, logistics and software licences. Additional heads include maintenance and spares, cleaning and sanitation, laboratory testing, factory insurance, professional fees, rent for sales depots and communication expenses. Regulatory compliance in food manufacturing incurs ongoing operational and auditing costs – FSSAI food licence costs ₹7,500 per year, local trade licence costs between ₹5,000 and ₹10,000, and food safety costs for certifications and testing must be included in projections. MSME/Udyam registration is free and unlocks subsidies and capital subsidies from government schemes. The regulatory landscape requires ongoing attention and budget provision.
Projected Profit and Loss Account for an Ice Cream Plant
The projected profit and loss account summarises expected performance over the projection period. Key lines include net sales, cost of raw materials, packaging cost, manufacturing expenses, employee cost, selling and distribution expenses, other operating expenses, EBITDA, depreciation, interest on term loan, interest on working capital, profit before tax, tax provision and profit after tax. Cost of goods sold includes direct material costs, direct labour and manufacturing overhead.
The core formulas:
- Gross Profit = Net Sales − Direct Cost of Production
- EBITDA = Operating Income − Operating Expenses (before interest, depreciation and tax)
- Profit Before Tax = EBITDA − Depreciation − Interest
Gross profit margins for ice cream plants range from 40–50%, but substantial fixed costs in cold chain management, sales overheads and distribution costs mean that net profit depends heavily on volume and capacity utilisation. Break-even analysis determines the production volume needed to cover all costs. Break-even points in ice cream production depend on fixed operating costs, variable costs and net revenue per unit.
An illustrative five-year P&L summary (illustrative only, mid-size automated plant):
| Particulars | Year 1 | Year 2 | Year 3 | Year 4 | Year 5 |
|---|---|---|---|---|---|
| Net Sales (₹ Lakh) | 1,397 | 1,990 | 2,480 | 3,010 | 3,350 |
| Raw Material & Packaging | 838 | 1,154 | 1,413 | 1,686 | 1,843 |
| Other Mfg & Operating Exp | 280 | 358 | 421 | 482 | 520 |
| EBITDA | 279 | 478 | 646 | 842 | 987 |
| Depreciation | 120 | 115 | 110 | 106 | 102 |
| Interest (TL + WC) | 135 | 125 | 110 | 92 | 75 |
| Profit Before Tax | 24 | 238 | 426 | 644 | 810 |
| Tax Provision | 6 | 60 | 107 | 162 | 204 |
| Profit After Tax | 18 | 178 | 319 | 482 | 606 |
All figures illustrative only. Actual outcomes depend on project-specific assumptions.
EBITDA does not represent actual cash available because loan repayments, working capital changes, capital expenditure and taxes must also be considered. A detailed exploration of margins and viability thresholds is available in our article on ice cream plant profitability and break-even analysis.
Projected Cash-Flow Statement and Liquidity Planning
A profitable ice cream manufacturing business on paper can still face liquidity stress. A cash flow statement tracks the timing of cash inflows and outflows in an ice cream plant, covering three sections: cash from operations (after working capital changes), cash used in investing activities (capital expenditure for fixed assets and essential equipment), and cash from financing (term loans, equity infusion, working capital borrowing and repayments).
Specific cash items relevant to this industry include the increase in inventory before summer, build-up of trade receivables during peak season, payment of interest and term-loan instalments, replacement capital expenditure, and statutory tax payments. Capital expenditures account for investments in heavy machinery and associated infrastructure. Seasonal cash flow gaps often require careful management of working capital in ice cream businesses.
An illustrative annual cash-flow summary (illustrative only):
| Particulars | Year 1 | Year 2 | Year 3 |
|---|---|---|---|
| Cash from Operations (before WC changes) | 138 | 293 | 429 |
| Working Capital Changes | (180) | (45) | (30) |
| Net Cash from Operations | (42) | 248 | 399 |
| Capital Expenditure | (15) | (20) | (25) |
| Term Loan Repayment | (80) | (100) | (120) |
| Net Cash Movement | (137) | 128 | 254 |
Figures in ₹ Lakh. Illustrative only.
Monthly cash-flow projections for at least the first 12 months of commercial production are essential to identify seasonal working capital peaks and avoid liquidity traps.
Projected Balance Sheet of an Ice Cream Factory
The projected balance sheet provides a snapshot of assets, liabilities and net worth at the end of each projected year. Key asset groups include gross block of fixed assets (buildings, plant and machinery, cold storage, vehicles, freezers), accumulated depreciation as per the depreciation schedule, inventory (raw materials, work in progress, finished goods), trade receivables, cash and bank balance, and other current assets.
Major liability and equity heads include promoter’s capital, reserves and surplus, term-loan outstanding, working capital borrowing (cash credit or working capital term loan), trade creditors and other current liabilities. Total assets must equal total liabilities plus equity for every projected year.
Investment in industrial infrastructure and automatic machinery appears under fixed assets. For a comprehensive view of how these costs build up, refer to our analysis of industrial ice cream plant setup cost in India.
Understanding Working Capital Requirement in an Ice Cream Plant
Working capital represents funds required to finance the time gap between paying for inputs – milk, cream, sugar, packaging materials, power, wages – and collecting money from customers. The formula is:
Net Working Capital Requirement = Current Assets − Current Liabilities (other than bank borrowing)
The main current asset components in an ice cream plant include raw-material inventory, packaging material inventory, work in progress, finished goods in cold storage, trade receivables and minimum cash balance. Current liabilities include trade creditors for milk suppliers, sugar vendors and packaging suppliers, statutory dues payable and other short-term payables.
Working capital for ice cream manufacturing business is typically financed partly through the promoter’s margin money and partly through bank facilities such as cash credit or working capital term loans.
Working Capital Operating Cycle in Ice Cream Manufacturing
The working capital cycle in ice cream manufacturing follows these stages: procurement of milk and other inputs from dairy farmers and suppliers, storage of raw materials, production and hardening, finished-goods storage in cold rooms, dispatch through refrigerated vehicles, sale on credit to distributors or institutional buyers, and receipt of payments.
Operating Cycle = Raw-Material Holding Period + Processing Period + Finished-Goods Holding Period + Receivable Period − Creditor Period
As an illustrative example only: if raw materials are held for 7 days, processing takes 2 days, finished goods remain in cold storage for 15 days, receivables take 21 days to collect and suppliers provide 10 days credit, the operating cycle is 7 + 2 + 15 + 21 − 10 = 35 days. A longer operating cycle directly increases the ice cream plant working capital requirement and, consequently, interest cost and financial risk.
Components of Working Capital Assessment for Bank Finance
Banks typically assess working capital based on norms such as holding days of inventory and receivables, linked to projected cost of sales and turnover. The assessment must break down each current-asset and current-liability component rather than relying on a single flat percentage of sales. This breakdown forms the core of CMA Data submitted to banks.
Raw Material and Packaging Inventory
Milk and cream may be procured daily, resulting in relatively low holding days (3–7 days), while sugar, skimmed milk powder, stabilisers, emulsifiers and packaging materials may be stocked for 15–45 days depending on procurement strategy (illustrative ranges only). Imported flavours or specialised ingredients may require higher stocking due to suppliers’ minimum-order quantities and logistics constraints. Inventory values are linked to projected monthly consumption from the P&L cost schedules.
Work in Progress (WIP)
WIP in an ice cream factory includes mix under pasteurisation, product in ageing tanks, semi-processed material before hardening and items between filling and final cold-room storage. A batch freezer operation or continuous freezer line may have different throughput speeds. WIP holding is generally short – measured in hours or 1–2 days – but its value must be included in working capital projections.
Finished Goods Inventory in Cold Storage
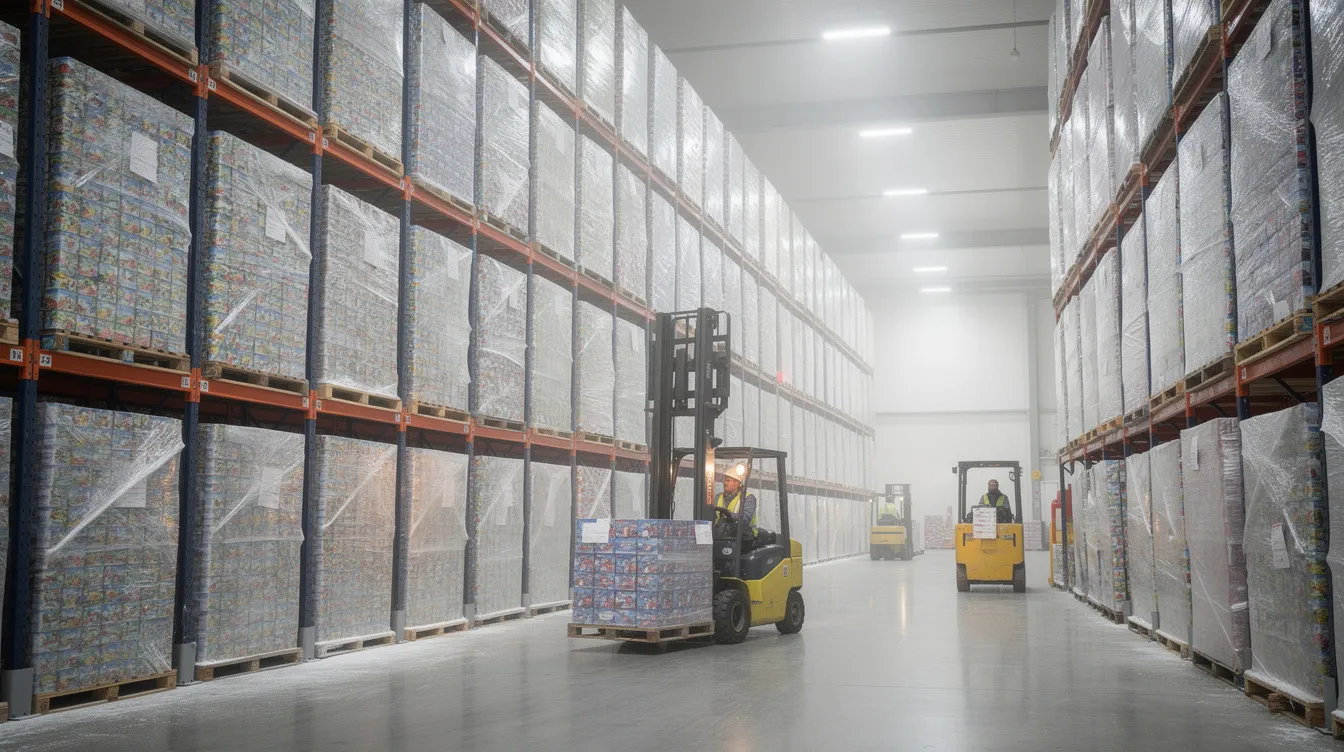
Finished-goods inventory is often the largest inventory component because plants pre-build stock ahead of summer or major institutional orders. Holding days should be segmented between peak season (when movement is faster) and off-season (when holding period stretches), though an annual average is used for bank assessment. Cold storage capacity and freezer space at distributor points influence realistic inventory days.
Trade Receivables
Credit terms to distributors, wholesalers, supermarkets and institutional buyers translate into average receivable days. Projections should consider a modest level of overdue receivables in early years rather than assuming perfect on-time payments. Some banks may not treat very old receivables as fully eligible for drawing-power purposes – promoters should verify individual bank policies and latest RBI guidelines.
Cash, Expenses Payable and Trade Creditors
A realistic minimum cash balance must be maintained for day-to-day expenses – wages, petty purchases, repairs and minor logistics – even when most sales are on credit. Trade creditors for milk, sugar, packaging and service providers reduce the net working capital gap through supplier credit. However, assuming unusually long credit periods without supporting letters of intent or past business relationships invites scepticism from lenders.
Illustrative Working Capital Calculation for an Ice Cream Plant
The following is an educational, hypothetical example for a mid-size industrial ice cream factory (illustrative only, not a standard for all projects):
| Component | Holding / Credit Days | Value (₹ Lakh) |
|---|---|---|
| Raw Material Inventory | 15 days of consumption | 52.00 |
| Packaging Material Inventory | 20 days of consumption | 18.00 |
| Work in Progress | 2 days | 8.00 |
| Finished Goods | 15 days of COGS | 55.00 |
| Trade Receivables | 25 days of sales | 96.00 |
| Cash & Other Current Assets | – | 12.00 |
| Total Current Assets | 241.00 | |
| Trade Creditors | 15 days | (42.00) |
| Other Current Liabilities | – | (10.00) |
| Total Current Liabilities | (52.00) | |
| Working Capital Gap | 189.00 | |
| Promoter’s Margin (25%) | 47.25 | |
| Proposed Bank Finance | 141.75 |
All figures illustrative only. Aligned with Year 1 P&L assumptions above.
This calculation forms the basis for sanction of a cash-credit limit or working-capital factory loan by banks, subject to each lender’s margin, security and assessment policy.
Seasonal Working Capital Requirement and Peak Funding Gap
The seasonal nature of ice cream demand makes working capital planning more complex than for many other FMCG products. Production and inventory typically rise in the months preceding peak summer – February through April – requiring higher cash outflow before corresponding sales realisations arrive. Market trends confirm that demand variation between peak and off-peak can be 3–4 times.
The peak working capital requirement (often in pre-summer or early summer) should determine the sanction limit, not the annual average. An illustrative quarterly pattern (illustrative only):
| Quarter | Inventory Level | Receivables Level | WC Requirement Index |
|---|---|---|---|
| Q1 (Apr–Jun) | High | Very High | Peak (130–140% of average) |
| Q2 (Jul–Sep) | Moderate | Moderate | Average (100%) |
| Q3 (Oct–Dec) | Low–Moderate | Moderate | Below average (80–90%) |
| Q4 (Jan–Mar) | Rising (pre-build) | Low–Moderate | Rising (110–120%) |
A static year-end balance sheet may understate the maximum funding gap. Banks may therefore ask for month-wise estimates and CMA Data to assess true peak exposure.
Working Capital Margin and Bank Finance for Ice Cream Factories
The working capital gap – total current assets minus current liabilities excluding bank borrowings – is funded partly by promoter’s margin money (typically 20–25% of the gap, subject to lender policy) and partly by bank facilities. Common facilities include cash-credit limits against stock and receivables, overdraft facilities, bill discounting and working-capital term loans. Primary security consists of inventory and receivables, with drawing power calculated periodically based on stock statements and book-debt statements submitted by the borrower. Limits are reviewed and renewed annually.
Bank loans for working capital carry interest that appears as an expense in the projected P&L and as a financing outflow in the cash-flow statement. RBI guidelines and individual bank assessment methods change over time and must be verified from official sources at the time of preparing the DPR.
Impact of Working Capital Management on Ice Cream Plant Profitability
Inadequate working capital leads to raw-material stock-outs, inability to pre-build inventory before summer, disrupted distribution and under-utilisation of plant capacity – directly reducing ice cream plant profitability and operational efficiency. Conversely, excessive inventory increases interest costs, raises the risk of product expiry or obsolescence and inflates cold-storage expenses.
Balancing inventory levels, monitoring ageing reports for both finished goods and receivables, and reviewing key ratios – inventory days, receivable days, creditor days and current ratio – are ongoing business management imperatives, not one-time exercises.
Projecting Interest on Working Capital in Financial Models
Interest on working capital facilities should be projected on expected average utilisation, not the entire sanctioned cash-credit limit. The formula:
Working Capital Interest = Average Expected Utilisation × Applicable Annual Interest Rate
As an illustrative example only: if average utilisation is ₹1.20 crore and the applicable rate is 11% per annum, projected interest is approximately ₹13.20 lakh for the year. Since utilisation is seasonal – higher before and during summer – modellers should ideally calculate month-wise utilisation and derive an annual average. Higher working capital interest lowers net profit and DSCR, reinforcing the need for disciplined inventory and receivable management.
Common Errors in Ice Cream Plant Financial Projections and Working Capital Planning
Common mistakes that weaken a proposed project and invite lender scepticism include:
- Assuming full capacity utilisation from Year 1 when market analysis shows otherwise
- Using MRP instead of net manufacturer realisation, thereby overstating projected revenue
- Underestimating packaging costs, especially for small-unit impulse ice cream products
- Ignoring seasonal working capital peaks and projecting only annual averages
- Underestimating power and refrigeration expenses and cold chain infrastructure costs
- Omitting wastage, returns and damaged products from variable costs calculations
- Using unrealistically short receivable periods or overstating supplier credit without documentation
- Excluding interest on working capital from the P&L entirely
- Preparing inconsistent projected P&L, cash-flow and balance sheet statements where inventory levels do not reconcile with cost of goods sold
- Treating projected profit as available cash without accounting for loan repayments and working capital changes
Sensitivity analysis should test variations in costs, sales volume and price elasticity to identify financial risk. Promoters and their Chartered Accountants should stress-test projections under lower-than-expected sales or higher input-cost scenarios.
Documents and Information Required to Prepare Bankable Projections
Promoters should collate the following for a robust DPR and CMA Data: detailed plant capacity and production schedule; proposed product mix with SKUs covering different ice cream brands or product lines; machinery quotations and layout for essential equipment; land and building details; estimated project implementation schedule (typically 12–15 months for a medium-scale plant); raw-material consumption norms per litre; packaging specifications for each format; power and utility requirements; manpower plan covering all departments; selling-price assumptions with distributor and retailer margins; proposed credit terms; inventory-holding policies reflecting business requirements; operational expenditure and capital investment schedules; loan amount and repayment period; expected interest rates; and promoter contribution.
For expansion projects, recent audited financial statements and current banking limits are required to integrate past performance with future expansion plans – enabling banks to assess whether future expansion is financially sustainable. Accurate data reduces appraisal queries and speeds up sanction.
Role of DPR and CMA Data in Bank Finance for Ice Cream Plants
A Detailed Project Report (DPR) and CMA Data together present an integrated picture of project cost, means of finance, operating assumptions, projected turnover, ice cream project profitability analysis, cash flow, balance sheet, working capital assessment, fund-flow statement and ratio analysis including DSCR and break-even. In the Indian banking context, CMA Data typically contains past performance (where available), projected financials, fund-flow and working-capital estimates in lender-prescribed formats.
Banks rely on these documents to assess term-loan and working-capital proposals for ice cream factories, determine sanction terms, collateral requirements and covenants. CA Manish Gugliya assists promoters in preparing realistic, internally consistent and lender-oriented DPRs, financial projections and CMA Data – he does not certify or guarantee loan sanctions.
Practical Recommendations for Ice Cream Project Promoters
- Prepare monthly projections for the first operating year to capture seasonal peaks and cash-flow troughs accurately.
- Build product-wise revenue assumptions reflecting realistic net realisation after trade margins, not MRP-based estimates.
- Differentiate between average and peak working capital – size your cash-credit request for the peak, not the average.
- Obtain written confirmation of supplier and distributor credit terms before incorporating them into projections.
- Include refrigeration, cold-chain and distribution costs with appropriate escalation – frozen desserts are energy-intensive.
- Maintain contingency provisions for implementation delays, cost escalation and supply chain disruptions.
- Run downside scenarios assuming 15–20% lower sales volume and 10–15% higher raw material costs to check DSCR resilience.
- Reconcile projected P&L, cash-flow and balance sheet before sharing with banks – inconsistencies erode credibility.
- Compare actual results against projections after commissioning and revise estimates promptly where deviations emerge.
- Engage professional support early – market demand assumptions, cost norms and lender expectations benefit from experienced review before large-ticket capital investment is committed.
Frequently Asked Questions on Ice Cream Plant Financial Projections
The following questions address practical issues commonly raised by entrepreneurs, financial consultants and lenders evaluating ice cream manufacturing projects.
How are five-year financial projections for an ice cream plant typically structured?
A standard ice cream plant five-year financial projections model covers projected profit and loss, cash-flow and balance-sheet statements, with a detailed Year 1 monthly breakup. It starts from capacity and product-mix assumptions, then builds revenue, cost, profit, working capital requirement and funding structure. Each schedule must be internally consistent – production volumes must tie to raw-material consumption, which must reconcile with inventory and cash-flow movements. The projection period for bank-funded projects is typically equal to the loan repayment tenure plus one year.
How much working capital is usually required for a medium-scale ice cream factory?
Actual working capital depends on scale, product mix, credit terms and seasonal intensity. For a medium-scale plant with annual turnover in the range of ₹12–₹25 crore, the working capital gap can be ₹3–₹6 crore during peak season (illustrative only). Every project needs a customised working capital calculation based on its specific inventory holding norms, receivable days and creditor terms rather than relying on thumb rules.
Which financial statements are compulsory in an ice cream plant DPR for banks?
Banks in India generally expect a projected profit and loss account, projected balance sheet, projected cash-flow statement, working-capital assessment including inventory and receivable schedules, term-loan repayment schedule, ratio analysis including DSCR, and CMA Data in their standard formats. Some lenders may also require a market analysis report and sensitivity analysis under adverse scenarios.
Why is seasonal working capital requirement higher than the annual average?
Before peak summer, plants build inventory and extend more credit to distributors while expenses such as power, refrigeration and logistics costs rise sharply. Because collections lag dispatches, the net cash tied up in stocks and receivables temporarily exceeds the average level seen in annual statements. A plant drawing its full cash-credit limit in April–May but utilising only 40–50% in November illustrates this dynamic.
Can government subsidies reduce the working capital burden for an ice cream project?
Government subsidies and interest subvention schemes – where available under the Ministry of Food Processing Industries, NABARD or state-level food processing policies – reduce overall funding cost and improve project viability. However, they generally do not replace the need for adequate working capital. Promoters should check latest applicable guidelines for capital subsidies and technology upgradation support, which primarily target capital expenditure rather than recurring working capital.
Conclusion
Robust ice cream plant financial projections and working capital requirement analysis must connect every operational variable – installed capacity, realistic capacity utilisation, product mix, net selling prices, raw-material and packaging costs, seasonal demand patterns, inventory holding, trade receivables and all debt obligations – into a coherent financial narrative. The ice cream industry offers attractive gross margins, but the heavy fixed costs of cold chain infrastructure, power-intensive operations and seasonal sales volume swings demand rigorous cash-flow planning alongside profitability analysis.
A project may appear profitable on an annual P&L basis yet encounter serious liquidity stress during commissioning, pre-summer inventory build-up or when large receivables are delayed. Professionally prepared projections, DPR and CMA Data help promoters present a credible, lender-friendly case that neither overstates returns nor understates risks.
Serious project promoters, dairy companies and investors planning an industrial ice cream manufacturing plant are welcome to reach out to CA Manish Gugliya through www.projectreportbank.com for assistance in preparing bankable DPRs, five-year financial projections, CMA Data and bank-finance presentations tailored to their specific project scale, product strategy and funding requirements.