

Key Takeaways
- A cheese manufacturing plant revenue model links milk intake, product mix, selling price, capacity utilisation and by-product income to arrive at net sales and profitability – installed capacity alone tells you nothing about viability.
- Mozzarella, processed cheese and cheddar each carry different revenue profiles, cash cycles and margin structures in the Indian cheese industry, and must be modelled separately.
- Bankable projections for a cheese plant must be based on realistic yields, validated market prices, phased ramp-up and adequate working capital – not just nameplate capacity.
- In my experience as a Chartered Accountant preparing DPRs and CMA Data, a robust revenue model is central for term-loan approval, DSCR comfort and long-term viability.
- All figures in this article are illustrative and must be customised for each project’s capacity, technology, location, milk sourcing and market strategy.
Introduction: Why the Revenue Model Matters More Than Capacity
Installing a 10 TPD or 20 TPD cheese manufacturing unit in India does not automatically ensure cheese plant profitability. The real driver is a sound, data-backed revenue model that converts technical assumptions – milk quantity, yield, product mix – into financial outputs such as sales, gross contribution, EBITDA and cash flow.
Cheese manufacturing plants operate in a dynamic agricultural and food-processing landscape. The global cheese market was valued at USD 98.0 billion in 2025 and is expected to reach USD 153.08 billion by 2034, growing at a CAGR of 5.1% from 2026 to 2034. Within India, the cheese market stood at approximately USD 1,869 million in 2025, with forecasts projecting growth to USD 3,367 million by 2031. The cheese manufacturing industry has a total addressable market of approximately $56 billion, and the cheese manufacturing industry has a CAGR of around 3.5% globally. The IMARC Group examines these market trends extensively, and their latest analysis confirms the strong demand trajectory, especially in the Asia Pacific region. This rising cheese demand – driven by QSRs, modern retail, new flavors and changing consumer preferences – is fuelling interest in industrial cheese production projects across India.
In my experience preparing cheese manufacturing project reports, lenders and investors primarily assess revenue stability, margin resilience, and the project’s ability to service term loans and working capital. This article focuses on industrial cheese manufacturing, not small artisanal units, and all assumptions must be tailored before submitting a cheese manufacturing project report for bank loan appraisal.
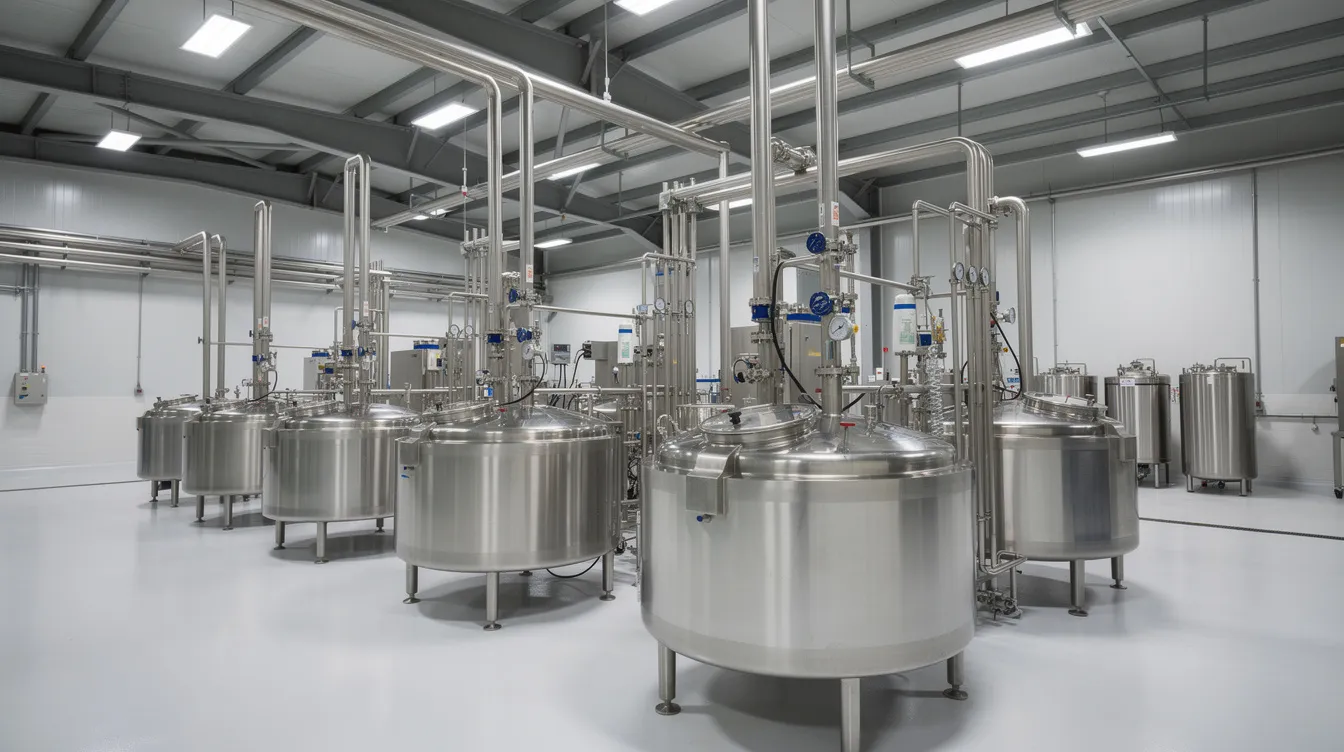
What Is a Cheese Manufacturing Plant Revenue Model?
A cheese manufacturing business model and revenue model describe how the proposed plant earns money from different cheese products, by-products and customer segments. It connects installed capacity – say 50,000 litres per day – to actual production volumes, capacity utilisation, and projected sales across the first 5–7 years. Typical cheese manufacturing plant capacity ranges from 5,000 to 10,000 MT annually for medium-scale operations, scaling higher for larger projects.
The cheese factory revenue model rests on these building blocks:
- Product-wise output based on milk allocation and yield
- Average net selling price after trade discounts and schemes
- Sales volume by channel (institutional, retail, private-label)
- By-product income (whey, trimmings)
The core formula is straightforward:
Product Revenue = Saleable Production Quantity × Average Net Selling Price
For example, if a plant produces 2,000 MT of mozzarella annually and the average net selling price is ₹480/kg, product revenue is ₹96 crore.
Total Operating Revenue = Cheese Sales + Whey By-product Revenue + Other Operating Income
GST collected on sales is not treated as operating revenue in financial projections. Only net-of-tax values feed into cheese manufacturing cost and profit analysis.
Main Revenue Streams of a Cheese Manufacturing Plant
Core cheese production revenue streams include mozzarella, processed cheese, cheddar, value-added variants and whey by-product income. An industrial cheese production economics assessment must consider each product family’s revenue and margin characteristics separately.
Mozzarella Cheese Revenue
Mozzarella is a primary volume driver in the Indian cheese business, with demand from pizza chains, QSRs, cloud kitchens, bakeries, frozen-snack manufacturers and institutional cheese sales to HoReCa channels. Pack formats range from 2–5 kg blocks and shredded bags for B2B buyers to smaller retail SKUs.
Long-term supply contracts with QSR brands support steady revenue but involve aggressive price negotiation and quality audits. Mozzarella yield depends heavily on milk type – approximately 10 litres of cow milk per kg, whereas buffalo milk can yield 20–22 kg per 100 litres. For plant design aspects, see our guide on Mozzarella cheese manufacturing plant.
Processed Cheese Revenue
Processed cheese revenue includes slices, cubes, cheese spreads, tins, pouches and food-service packs. Strong branding can help cheese products command higher prices than commodities, but packaging, promotion and distribution networks add to costs.
Product positioning – value, mid-premium, or premium – directly shapes the cheese plant profit margin for processed cheese. Contract manufacturing and private-label supply to retail chains can support capacity utilisation but at thinner margins. For capacity and process details, refer to Processed cheese manufacturing plant.
Cheddar Cheese Revenue
Cheddar serves a dual role: a standalone retail product and a base cheese for processed cheese formulations. Different cheddar cheese manufacturing profit margin profiles arise from retail sales (₹500–700+/kg for premium natural variants) versus bulk sales to food processors at lower rates.
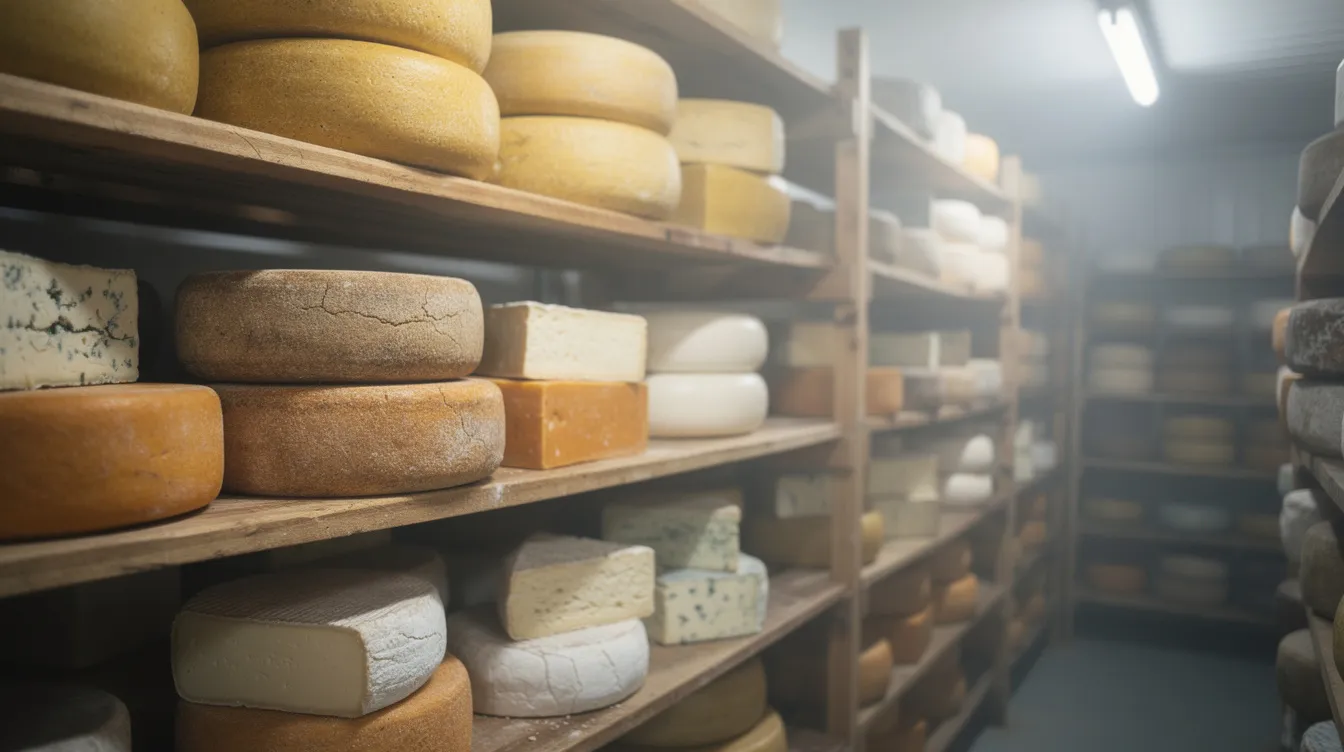
Cheddar requires aging rooms and maturation periods of months or longer, tying up working capital and delaying cash conversion. This must be reflected in cheese plant financial projections. Technical and setup aspects are covered separately in our Cheddar cheese manufacturing plant guide.
Revenue from Cheese Variants and Value-Added Products
Key variants – pizza cheese, flavoured cheese, shredded cheese, cheese spreads, food-service packs, retail cubes and slices – can widen the revenue base. Specialty cheeses generally command higher consumer markups over standard commodity types. However, every new SKU must be evaluated for its impact on packaging cost, line changeover time, marketing budget and cold chain complexity.
In the early years, plants should prioritise a focused cheese plant product mix and revenue analysis rather than launching too many SKUs simultaneously.
Whey and Other By-Product Revenue
Whey protein products have gained importance as high-value revenue streams in the cheese industry. Liquid whey is a byproduct of cheese production that can be monetized instead of disposed of – through sale to cattle-feed producers, whey-based beverages, whey powder production, or supply to third-party processors.
Byproduct utilization from cheese production can significantly influence overall profitability. At scale, whey volumes can exceed cheese output by volume – for example, Parag Milk Foods’ Manchar plant produces approximately 1,100 kg of cheese and 11,000 litres of whey per vat cycle. However, whey by-product revenue should be included in projections only when backed by quotations or draft purchase agreements.
Cheese Product Mix and Its Effect on Revenue
Product mix – the share of mozzarella versus processed cheese versus cheddar versus other variants – has a strong impact on average selling price, yield, production cycle and working capital needs. A higher share of B2B mozzarella sales may increase volume but compress margins, whereas branded processed cheese can improve per-kg margins but requires more marketing spend. For a deeper discussion, see Cheese plant capacity and product mix.
| Product Category | Primary Customer | Pricing Potential | Inventory Cycle | Margin Potential | Major Revenue Risk |
|---|---|---|---|---|---|
| Mozzarella | QSRs, food service | Medium | Short | Medium | Price pressure from large buyers |
| Processed cheese | Retail, distributors | Medium–High | Short–Medium | Medium–High | Brand competition, promo costs |
| Cheddar | Retail, processors | Medium–High | Long (aging) | Medium–High | Working capital lock-in |
| Value-added variants | Retail, online, HoReCa | High | Medium | High | Slow offtake, cold chain cost |
Promoters should simulate at least two alternative product-mix scenarios in the cheese manufacturing plant ROI analysis: one volume-driven and one margin-focused.
How to Calculate Cheese Plant Sales Revenue
Cheese yield indicates how much cheese is produced from a given amount of milk. Here is the step-by-step workflow:
- Daily milk-handling capacity: e.g., 50,000 litres/day
- Operating days: 300 days/year (typical in Indian conditions, accounting for dairy farming seasonality and maintenance)
- Annual Milk Processed = Daily Capacity × Operating Days × Capacity Utilisation
- Allocate milk among products (e.g., 55% mozzarella, 25% processed, 15% cheddar, 5% variants)
- Saleable Cheese Output = Milk Allocated × Expected Yield × (1 − Production Loss %)
- Gross Product Sales = Saleable Quantity × Gross Selling Price
- Net Sales Revenue = Gross Sales − Trade Discounts − Sales Returns − Sales Incentives
Typical production loss allowances for cutting, trimming and packaging run at 1–3% in well-managed plants. Yield and losses depend on cheese variety, milk composition, moisture level and technology. A brief overview of the Industrial cheese production process covers the technical conversion steps.
Illustrative Cheese Plant Revenue Projection
The following is a hypothetical example for a 50,000 LPD plant at 60% capacity utilisation (Year 1), 300 operating days. All figures are illustrative only.
| Parameter | Mozzarella | Processed Cheese | Cheddar | Variants |
|---|---|---|---|---|
| Milk allocation | 55% | 25% | 15% | 5% |
| Milk processed (lakh litres) | 49.5 | 22.5 | 13.5 | 4.5 |
| Indicative yield (kg per 100L) | 10 | 10.5 | 9.5 | 10 |
| Saleable output (MT, after 2% loss) | 485 | 232 | 126 | 44 |
| Net selling price (₹/kg) | 470 | 500 | 520 | 580 |
| Product sales (₹ crore) | 22.8 | 11.6 | 6.5 | 2.6 |
Whey by-product revenue (est.): ₹1.5 crore Total Operating Revenue (Year 1): ~₹45 crore
The same capacity at different selling prices, yields or utilisation levels can dramatically change total operating revenue. All prices, yields and capacity-utilisation levels must be validated through up-to-date quotations, techno-economic studies and market surveys at the DPR stage.
Capacity Utilisation and Year-Wise Revenue Ramp-Up
A new cheese plant should not project 100% capacity utilisation from the first year. High-volume cheese production requires maintaining near-maximum capacity to absorb fixed overhead costs, but ramp-up takes time. Operational efficiency influences both cost reduction and capability to meet demand as production scales up.
| Year | Capacity Utilisation | Production (MT) | Net Sales (₹ cr, approx.) | EBITDA Trend |
|---|---|---|---|---|
| 1 | 55–60% | ~887 | ~45 | Marginal |
| 2 | 70–75% | ~1,140 | ~58 | Improving |
| 3 | 80–85% | ~1,330 | ~68 | Positive |
| 4+ | 85–90% | ~1,400 | ~72 | Stable |
Key factors affecting ramp-up include milk procurement network development, distributor appointments, institutional contract approvals, retail branding timelines and adequacy of working capital. In my experience, conservative ramp-up assumptions improve credibility in a cheese manufacturing project report for bank loan appraisal.
Selling Price and Net Realisation
Revenue models should focus on net realisation at the factory gate, not MRP. The gap between MRP and ex-factory price can be 15–30% or more, depending on distribution channel and bargaining power.
For instance, a processed cheese MRP of ₹120 per 200 g (₹600/kg) may yield an ex-factory net of only ₹420–480/kg after distributor margin, retailer margin, promotional schemes and freight. Projections for cheese manufacturing cost and profit must use realistic net selling prices confirmed through buyer discussions, not aspirational MRP alone.
Customer Segments and Distribution Channels
The cheese factory revenue model depends on a balanced mix of customer segments and distribution channels. Distribution channels for cheese can include supermarkets, restaurants and food manufacturers. Cheese distribution channels vary by buying power and economies of scale.
Institutional and B2B Sales
Institutional buyers – pizza chains, hotels, caterers, food processors – offer steady volumes and lower packaging costs per kg. However, pricing is tight, quality audits are rigorous, and dependence on a few large accounts creates concentration risk. Institutional focus can be attractive in early years to scale cheese plant capacity utilisation quickly.
Distributor and Retail Sales
Distribution strategies impact cheese profit margins significantly. Supermarkets benefit from short supply chains and low costs, while longer supply chains increase cheese selling prices through intermediary margins. Branded retail SKUs may offer higher net realisation but involve packaging, promotional schemes, returns and cold chain costs. The chill chain is crucial for maintaining cheese quality during distribution, and maintaining strict temperature control throughout the supply chain prevents spoilage.
Direct and Online Sales
Direct institutional supply, company-operated depots and B2B e-commerce platforms serve food-service customers. Online grocery channels are relevant for branded processed cheese in urban markets but typically represent a small percentage of total volume.
Private-Label and Contract Manufacturing
Utilizing excess plant capacity for contract manufacturing can provide stable income. However, it involves lower per-kg margins and strong negotiation power of buyers. Avoid over-dependence on private-label orders in the base-case scenario.
Cheese Pricing Strategy
Sustainable pricing must blend cost-plus logic with market-based considerations. Key approaches include cost-plus pricing for institutional contracts, competitor-based pricing for retail SKUs, and premium pricing for specialised cheeses. Consumer preferences for artisanal cheeses can greatly affect market demand and profitability in the premium segment.
Pricing below total cost for extended periods may generate turnover but damage medium-term cheese plant profitability and DSCR. Separate pricing strategies should be modelled for mozzarella, processed cheese and cheddar within the cheese plant product mix and revenue analysis, understanding input costs for each product line.
Revenue Versus Profitability
High revenue does not mean high profit. Profitability in cheese manufacturing depends on capturing value from raw milk through efficient processing, cost control and smart distribution. Cheese manufacturing plants have gross profit margins of 30–40%, while EBITDA margins for mainstream cheese typically run at 11–13% and specialty variants can reach 16–18%, according to CRISIL’s dairy research.
Gross Contribution = Net Sales − Variable Production and Selling Costs EBITDA = Net Sales − Operating Costs Before Interest, Depreciation and Tax
Common reasons for weak profitability despite high turnover: expensive milk procurement, poor yields, heavy trade discounts, power-intensive operations, underutilised capacity, and slow receivables. For equipment-related cost impacts, see Cheese plant machinery and equipment cost.
Major Cost Drivers Affecting the Revenue Model
Raw material costs, particularly milk prices, directly affect the cost of goods sold in cheese production. Raw materials, especially milk, account for 70–80% of operating costs. Operating costs also include utilities and maintenance alongside raw material economics.
Effective milk procurement strategies are essential for cost control in cheese manufacturing. Higher raw milk prices or lower fat content increase cost per kg of cheese, tightening the cheese plant profit margin if selling prices are not adjusted. A detailed discussion of setup and operating costs is available in our guide on Cheese manufacturing plant setup cost in India. Obtain at least 2–3 quotations for major inputs before finalising the DPR.
Working Capital Impact on the Revenue Model
Increasing sales requires increased working capital for raw milk purchases, ingredient stocks, cheese aging inventory and customer credit. The main components include raw material inventory, packaging inventory, aging cheese (for cheddar), finished goods in cold storage and trade receivables.
Typical credit patterns in India run 15–45 days for distributors and 30–60 days for institutional buyers. Projected sales must be consistent with available working-capital limits; otherwise, planned turnover cannot be achieved. Revenue models should be prepared together with a quarter-wise working-capital assessment to avoid liquidity stress during ramp-up.
Revenue Risks and Sensitivity Analysis
Banks now expect sensitivity analysis in cheese plant financial projections. Key risk variables include raw milk purchase price, cheese yield, plant downtime, market selling price, product mix shifts and loss of major customers.
| Adverse Change | Revenue Impact | EBITDA Impact |
|---|---|---|
| Selling price drops 5% | Revenue falls ~5% | EBITDA may fall 20–30% |
| Milk cost rises 10% | No direct revenue change | EBITDA may fall 25–40% |
| Utilisation drops to 50% | Revenue falls ~15–20% | EBITDA may turn negative |
Test at least base, optimistic and conservative scenarios. Such financial analysis is essential for both promoters and lenders to understand robustness of the cheese manufacturing plant ROI under real-world conditions and to influence investment decisions.
Role of Project Cost and Means of Finance
The revenue model must ultimately support term-loan instalments, interest, working-capital interest, replacement capex and promoter returns. Capital expenditure includes machinery and land development costs. Project cost and means of finance – equity, term loan, subsidies – determine annual repayment obligations. A structured view is available in our note on Cheese plant project cost and means of finance.
Aggressive repayment schedules can strain cash flow if revenue ramp-up is slower than assumed. Lenders prefer comfortable DSCR over the full blog of the project tenure rather than very high revenue projections based on optimistic assumptions.
Financial Indicators for Evaluating the Revenue Model
Key indicators: revenue growth, gross contribution percentage, EBITDA margin, profit before tax, cheese manufacturing break-even point, DSCR, interest coverage ratio, return on investment, IRR and payback period. There is no single ideal number for every project; acceptable ranges depend on plant size, borrowing level, repayment period and financial performance benchmarks.
Banks focus on DSCR trends over 7–10 years. Equity investors give more weight to IRR and payback. Monitor inventory and receivable cycles alongside these ratios, as slow rotation can erode profitability even when the P&L appears strong.
Related Cheese Manufacturing Guides
- Cheese manufacturing plant setup cost in India
- Cheese plant machinery and equipment cost
- Cheese plant capacity and product mix
- Industrial cheese production process
- Cheese plant project cost and means of finance
- Mozzarella cheese manufacturing plant
- Processed cheese manufacturing plant
- Cheddar cheese manufacturing plant
Information Required to Prepare a Bankable Revenue Model
Before approaching a consultant, compile:
- Capacity details: proposed milk-processing capacity per day, target products, cheese types, planned commissioning date, operating days per year
- Product mix and yield: expected products, allocation percentages, yield assumptions
- Market inputs: target market segments, expected selling prices with supporting quotations, distribution margins, expected credit periods
- Cost data: raw milk sourcing area, seasonal milk premiums, packaging material prices, utility tariffs, labor availability, logistics cost and transportation arrangements
- Financial inputs: project cost estimate, term-loan amount, promoter contribution, repayment tenure, working-capital limit
The more specific the inputs, the more realistic and bankable the cheese manufacturing break-even point and DSCR analysis will be, providing insights that stand up to bank scrutiny.
Common Mistakes in Cheese Plant Revenue Projections
- Assuming 90–100% capacity utilisation from Year 1
- Using MRP instead of net realisation and ignoring distributor and retailer margins
- Applying unrealistic cheese yield without adjusting for actual milk composition
- Neglecting aging and storage periods for cheddar, which affect the value chain and cash cycle
- Overestimating whey by-product revenue without confirmed buyer contracts
- Assuming uniform profit margins across all cheeses and ignoring the competitive landscape
- Ignoring milk-price volatility and seasonal supply chain variations
- Copying financial assumptions from another project without validating against own capacity, scale and market arrangements
Sensitivity analysis and documentary support – quotations, draft contracts, market research – strengthen the revenue model’s credibility in front of bankers evaluating a new facility or capacity expansion.
How CA Manish Gugliya Can Assist
CA Manish Gugliya (FCA, DISA ICAI) is a practising Chartered Accountant with over 20 years of experience in preparing detailed project reports, CMA Data, financial projections and bank-loan DPRs for manufacturing and dairy products projects. Services for cheese plants include:
- Product-wise revenue models and cheese plant financial projections
- Working-capital assessment and DSCR/repayment analysis
- Break-even and sensitivity analysis
- Investor-ready financial presentations
Every project report is tailored to the specific capacity, technology, product mix, location, procurement strategy and means of finance of the proposed plant. Projections are prepared with professional care but are indicative – actual outcomes depend on implementation, market conditions, legal requirements and resource efficiency.
Visit www.projectreportbank.com to discuss your proposed cheese manufacturing business and obtain a customised, bank-ready revenue model and DPR. The process covers several key factors and important considerations relevant to manufacturers evaluating capacity expansion, whether for a viable operation or a completely new facility in the dairy industry.
Disclaimer: All figures, margins and projections in this article are illustrative. Actual results will depend on project-specific technical, financial and market assumptions. Nothing in this article constitutes a guarantee of finance approval, profitability or investment decisions. Readers must validate all inputs through independent technical, commercial and financial analysis before committing capital.
Frequently Asked Questions
How different is the revenue model for a small (5,000 LPD) plant versus a large (50,000 LPD) plant?
A smaller plant has fewer product-mix options, limited bargaining power on milk procurement and restricted access to large institutional buyers. Economies of scale in packaging, cold storage, distribution and marketing are harder to achieve. Profit margins tend to be tighter, and fixed-cost absorption is slower. A larger plant can spread overheads across higher volumes and negotiate better input costs, though it also requires significantly more working capital and a wider distribution network. The revenue model assumptions – especially selling price, yield and ramp-up speed – differ materially between the two.
Can an existing dairy plant add cheese manufacturing as a side line and still prepare a separate revenue model?
Yes. A dedicated cheese manufacturing business model can be built as a segment within an integrated dairy, with separate tracking of milk accounting and allocation, yield, selling prices and contribution. Lenders often appreciate this clarity, as it demonstrates that the cheese line’s financial performance can be evaluated independently.
How often should a running cheese plant update its revenue model and projections?
At a minimum, update the model annually for strategic planning. Revisit key assumptions – milk price, selling price, product mix, capacity utilisation, market trends – whenever a significant change occurs, such as the entry of a new competitor, shift in cheese demand, or major policy or regulatory development.
Is it necessary to include export sales in the initial revenue model?
Include export revenue only where there is a realistic plan, preliminary buyer interest and awareness of processing requirements and legal requirements for the target market. Otherwise, base-case projections should rely on domestic demand. The environmental impact and compliance costs of export certifications should also be considered.
What professional disclaimer should accompany cheese plant revenue projections?
Every DPR should include a brief disclaimer stating that projections are based on stated assumptions, do not represent guaranteed results, and must be reviewed in light of actual market, technical and regulatory developments before any investment decisions. This protects both the promoter and the consulting professional.