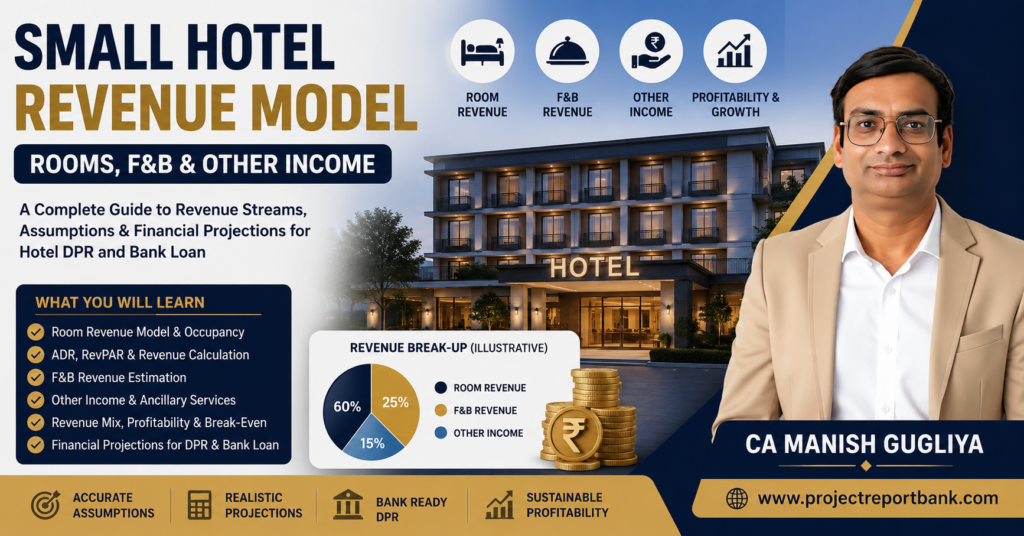
If you are planning a small hotel – say 10, 20 or 30 rooms – the single most important financial question you need to answer is: how much revenue will this property realistically generate? Not the best-case fantasy, but a number your banker will accept and your operations will actually deliver.
A surprising number of promoters walk into bank meetings with projections built on a dangerously simple formula: number of rooms × maximum tariff × 365 days. That number has almost no relationship with reality. A credible small hotel revenue model accounts for occupancy, average daily rate after discounts, food and beverage income, ancillary services, seasonality and ramp-up – and it must hold together under scrutiny.
This article explains, step by step, how hotel revenue should be estimated for a bankable DPR (Detailed Project Report) in India. The perspective is that of a practising Chartered Accountant who regularly prepares project reports and financial projections for small and budget hotel projects.
Key Takeaways
- A realistic small hotel revenue model is built on rooms actually sold (occupancy × ADR), plus food and beverage income and ancillary revenue streams – not “rooms × rack rate × 365.” Small hotels face unique challenges compared to large chains, and the revenue model must reflect those realities.
- For a bankable DPR and loan proposal, revenue assumptions must be conservative, location-specific and internally consistent with project cost, operating capacity and DSCR expectations of Indian banks. Lenders routinely reject projections where occupancy or ADR appear inflated.
- This article provides worked illustrative examples for 10-room, 20-room and 30-room hotels, covering hotel room revenue calculation, RevPAR, F&B estimates, ancillary income and total revenue. Key performance indicators for hotel revenue management include occupancy rate and RevPAR, and both are explained in practical detail.
- Revenue is not profit. Operating expenses, interest and loan repayment must be serviced from cash accrual. Overly aggressive revenue assumptions can make a hotel project report unacceptable to lenders, regardless of how attractive the numbers look on paper.
- The content is written from the professional viewpoint of CA Manish Gugliya (ProjectReportBank.com), focusing on how to build realistic, defensible revenue projections for small hotel DPRs in India. Effective revenue management strategies can increase profits by 25% to 95%, but only when the underlying assumptions are sound.
Explore Small Hotel Project Report Guides
Explore our complete Small Hotel Project Report and DPR guides covering setup cost, equipment, project cost, revenue, financial projections, occupancy, feasibility, project finance and bank loan assessment.
Why Small Hotel Revenue Cannot Be “Rooms × Tariff” Only
The most common mistake I encounter when promoters approach me for a hotel project report is a revenue estimate derived by multiplying their total room count by the highest displayed tariff and then by 365 days. A 20-room hotel with a tariff card showing ₹4,000 per night suddenly becomes a ₹2.92 crore annual revenue business on paper. Banks see through this immediately.
The reality is that actual hotel revenue depends on available room nights, the occupancy rate you can realistically achieve, the average daily rate (ADR) after accounting for discounts, OTA commissions, complimentary rooms and free upgrades. According to FHRAI-Horwath survey data, small hotels with fewer than 50 rooms in India show average occupancy of approximately 47.5% and an ADR of around ₹2,866 – a far cry from the “full house at rack rate” scenario many promoters assume.
The core revenue formula for any hotel revenue model in India is:
Total Revenue ≈ (Available Rooms × Occupancy × ADR) + F&B Revenue + Ancillary Services Revenue
For DPRs and bank loans, assumptions must factor in location (highway hotel, Tier-2 city, pilgrimage town, tourist hill station), competition from existing properties, seasonality (monsoons, festival peaks, lean summer months) and the target guest segment (budget travellers, business travelers, family groups). Revenue management helps independent hotels improve performance across the business, but only when the foundational assumptions are grounded in reality.
Throughout this article, the explanations stay practical and India-specific, aimed at small and budget hotels of 10, 20 and 30 rooms.
Overview of the Small Hotel Revenue Model
A small hotel revenue model is the structured framework through which a hotel earns money from its rooms, food and beverage operations and other services over the course of a year. It is not a single number – it is a set of interlinked assumptions, each with its own logic.
In typical budget hotels, room revenue constitutes the dominant share of total revenue. FHRAI data for “Others (<50 rooms)” shows rooms contributing approximately 50.6% of total revenue, with food accounting for around 45%. However, this mix is far from universal. A pure lodging hotel with no restaurant might derive 85–90% from rooms, while a property with an active restaurant and small banquet hall could see rooms at 60–70%.
The three main revenue heads:
- Room Revenue – the core business; room bookings through OTAs, direct bookings, walk-ins and corporate contracts
- Food & Beverage Revenue – restaurant sales, breakfast, room service, café, catering
- Other / Ancillary Revenue – laundry, travel desk, parking fees, local experiences, event space, extra-bed charges
From a CA and DPR perspective, each revenue head needs its own assumptions and working sheets. Revenue management is important precisely because it forces discipline across these categories. The later sections of this article show how these revenue opportunities translate into total revenue, EBITDA and eventual DSCR for term-loan repayment.
Room Revenue as the Core of a Small Hotel Revenue Model
For most 10–30 room hotels in India, room revenue is the primary driver of viability. It is the most predictable component and the key anchor around which all other projections are built. Without credible room revenue, no amount of F&B or ancillary income will make a DPR bankable.
Room revenue is relatively easier to forecast compared to banquets or events because it depends on measurable variables: occupancy rate, ADR, distribution strategies (direct vs OTA mix) and guest segments. Corporate and group contracts can secure baseline occupancy for small hotels, providing a degree of predictability that pure walk-in properties lack.
Banks routinely check whether projected room revenue is consistent with the average room rate in hotel properties of a comparable category in the same locality. If neighbouring budget hotels show ADR of ₹2,500–₹3,500 and occupancy around 50–60%, a promoter claiming ₹5,000 ADR and 80% occupancy from day one will face immediate pushback.
Room revenue is influenced by dynamic pricing, length of stay, room availability, the booking channel mix and whether the hotel has implemented even basic pricing strategies. Effective revenue models for small hotels combine dynamic pricing with guest segmentation to maximise room revenue without simply raising rack rates.
Step-by-Step Room Revenue Model – Formulas & Logic
Here are the formulas every promoter should understand before preparing hotel revenue projections:
Step 1: Available Room Nights (ARN)
ARN = Number of Rooms × 365
For a 20-room hotel: 20 × 365 = 7,300 available room nights per year
Step 2: Occupied Room Nights (ORN)
ORN = ARN × Occupancy Rate
At 55% occupancy: 7,300 × 0.55 = 4,015 occupied room nights
Step 3: Room Revenue
Room Revenue = ORN × ADR
At ADR ₹3,000: 4,015 × ₹3,000 = ₹1,20,45,000 (≈ ₹1.20 crore)
Step 4: RevPAR (Revenue per Available Room)
RevPAR = ADR × Occupancy Rate = ₹3,000 × 55% = ₹1,650
Or equivalently: Room Revenue ÷ ARN = ₹1,20,45,000 ÷ 7,300 = ₹1,650
These calculations are straightforward, but the quality of the output depends entirely on how realistic your occupancy and ADR assumptions are. Small hotels should track net revenue per room rather than just occupancy rates, because a high occupancy at deeply discounted rates may not generate adequate cash accrual.
Illustrative Room Revenue Examples – 10-Room, 20-Room & 30-Room Hotels
The following examples are purely illustrative. They demonstrate the hotel room revenue calculation methodology, not guaranteed market benchmarks.
10-Room Budget Hotel (Tier-3 Town, Year 1)
| Particular | Value |
|---|---|
| Number of Rooms | 10 |
| Available Room Nights | 3,650 |
| Assumed Occupancy | 45% |
| Occupied Room Nights | 1,643 |
| Illustrative ADR | ₹2,500 |
| Annual Room Revenue | ₹41.07 lakh |
| Monthly Room Revenue (avg.) | ₹3.42 lakh |
20-Room Hotel (Tier-2 City, Year 1)
| Particular | Value |
|---|---|
| Number of Rooms | 20 |
| Available Room Nights | 7,300 |
| Assumed Occupancy | 50% |
| Occupied Room Nights | 3,650 |
| Illustrative ADR | ₹3,200 |
| Annual Room Revenue | ₹1.168 crore |
| Monthly Room Revenue (avg.) | ₹9.73 lakh |
30-Room Hotel (Tourist/Business Location, Year 2)
| Particular | Value |
|---|---|
| Number of Rooms | 30 |
| Available Room Nights | 10,950 |
| Assumed Occupancy | 60% |
| Occupied Room Nights | 6,570 |
| Illustrative ADR | ₹3,800 |
| Annual Room Revenue | ₹2.497 crore |
| Monthly Room Revenue (avg.) | ₹20.81 lakh |
A 5% increase in occupancy for the 20-room hotel (from 50% to 55%) adds approximately ₹11.68 lakh to annual room revenue. Similarly, raising ADR by just ₹200 at 50% occupancy adds ₹7.30 lakh. Small changes in either variable create meaningful revenue swings – a fact that makes accurate forecasting essential for any hotel revenue projection for bank loan.

Understanding Hotel Occupancy Rate in Financial Terms
Occupancy rate is the percentage of available rooms actually sold in a given period. It is central to hotel occupancy revenue calculation and determines whether your property generates enough revenue to cover costs and service debt.
Key demand drivers for occupancy include:
- City type – business cities, tourist destinations, pilgrimage centres, highway locations each have distinct demand patterns
- Micro-location – proximity to railway stations, bus stands, industrial areas, hospitals, courts
- Seasonality – summer vacations, Diwali, wedding season (November–February in North India), monsoon lulls
- Local events – exhibitions, conferences, college admissions, religious festivals
- Competition – number and quality of existing hotels in the catchment area
Online travel agencies, Google ratings, social media reviews and guest satisfaction scores significantly influence achievable occupancy over time. Direct bookings save hotels 15–25% in OTA commissions and allow hotels to control guest experiences better, which is why building a strong online presence increases direct bookings as the property matures.
The concept of ramp-up is critical. Year 1 occupancy for a new hotel is typically lower – perhaps 35–45% – with gradual improvement over 2–3 years as the hotel becomes known, reviews accumulate and corporate tie-ups develop. BrandSync’s hotel performance benchmarks show stabilised budget hotels achieving 62–74% occupancy, but this takes time.
In a bankable DPR, occupancy should be projected as gradually increasing and then stabilising, rather than starting unrealistically at 80–90% from the first month. Minimum length of stay restrictions can enhance revenue during busy periods, and length of stay controls can maximize occupancy during high-demand periods such as festivals or long weekends.
Average Daily Rate (ADR) – Price Realisation vs Tariff Card
ADR is defined as:
ADR = Room Revenue ÷ Rooms Sold (Occupied Room Nights)
If a 20-room hotel sells 100 rooms in a week and earns ₹2,80,000, the ADR is ₹2,800 – regardless of what the tariff card displays.
ADR is always lower than the highest published room rates because of:
- OTA discounting and commissions
- Corporate contracts at negotiated rates
- Group bookings at bulk rates
- Off-peak promotions
- Complimentary rooms and upgrades
- Dynamic pricing that adjusts rates based on demand and competition
Customer segmentation enables tailored pricing and promotions. A hotel serving both business travelers during weekdays and family groups on weekends can maintain better ADR by applying different pricing strategies to each segment. Real-time data analysis allows for faster pricing adjustments, and tiered room packaging increases perceived value and average daily rate.
For a DPR, ADR assumptions must be cross-checked with actual rates of comparable hotels. I typically advise promoters to check room rates on major OTAs for 3–5 similar properties in their locality across different dates. ADR escalation of 4–6% per annum is considered reasonable for most budget properties, supported by inflation, service improvements and better guest reviews.
Revenue per Available Room (RevPAR) – Combining ADR & Occupancy
RevPAR combines pricing power and occupancy into a single metric:
RevPAR = ADR × Occupancy Rate
Or: RevPAR = Room Revenue ÷ Available Room Nights
For the 20-room hotel example above: RevPAR = ₹3,200 × 50% = ₹1,600
RevPAR provides a clearer picture of hotel performance than either ADR or occupancy alone. A hotel with ₹4,000 ADR but 35% occupancy (RevPAR = ₹1,400) underperforms compared to one with ₹2,800 ADR at 60% occupancy (RevPAR = ₹1,680).
For DPR purposes, RevPAR helps check internal consistency of assumptions. Hotels using revenue management systems can optimize RevPAR and GOPPAR by testing alternative scenarios – lower ADR with higher occupancy versus higher ADR with lower occupancy – to see which yields better results after accounting for variable costs.
Total Revenue Per Available Room (TRevPAR) expands revenue generation beyond just room sales by including F&B and ancillary income, making it a more comprehensive KPI for properties with diversified revenue streams.
Food & Beverage (F&B) Revenue Model for Small & Budget Hotels
F&B revenue in small hotels can range from negligible (a lodging-only property offering no meals) to substantial (a hotel with a full restaurant and catering service). There is no single percentage rule that applies across all properties.
Common F&B revenue components include:
- Complimentary or paid breakfast
- In-house restaurant for hotel guests
- Walk-in customers from the local area
- Room service
- Café or snack counter
- Corporate meals and small events
- Catering for functions
Two standard estimation approaches work well:
Approach 1: Occupied Rooms × Average Guests per Room × Average F&B Spend per Guest
Example: 3,650 occupied rooms × 1.5 guests × ₹250 spend = ₹13.69 lakh annually
Approach 2: Total Covers per Day × Average Bill Value × Operating Days
Example: 25 covers/day × ₹200 average bill × 350 days = ₹17.50 lakh annually
Upselling can increase revenue per guest significantly when done thoughtfully. Effective upselling feels like thoughtful recommendations, not pushy sales – suggesting a combo meal, a dessert add-on, or a room-service breakfast package. Cross-selling introduces guests to other hotel services, such as offering a discounted meal package at check-in. Integrating upsell offers into CRM systems enhances personalization and improves average spend.
In a DPR, F&B revenue must be aligned with realistic seating capacity, kitchen size, staffing levels and whether the restaurant will also target local residents as walk-in customers. Roughly 40% of incremental hotel revenue growth comes from non-room categories, which underscores why F&B deserves careful planning.

Banquet, Meeting & Event Income – When to Include It
Not every small hotel has banquet or conference facilities. Revenue from this category should only be projected when the proposed project actually includes appropriate halls, lawns or meeting rooms.
Common event types in Indian small hotels:
- Birthday and kitty parties
- Pre-wedding functions (haldi, mehendi, sangeet)
- Small corporate conferences and training programs
- Society meetings and cultural events
Revenue from booked events and unused space can provide secondary income for small hotels that have the infrastructure. A simple estimation approach:
Number of Events per Month × Average Billing per Event × 12 months
For example: 4 events/month × ₹25,000 average billing × 12 = ₹12 lakh annually
Banks often discount highly optimistic banquet projections unless backed by clear location advantages (proximity to corporate offices, wedding venues being scarce locally) or existing tie-ups. Banquet income can be volatile and seasonal – in lean months, it may be zero.
Ancillary Services & Other Hotel Income
Ancillary revenue streams include food and beverage services, parking fees and local experiences, among others. While individually small for a budget hotel, these add up and often carry attractive margins.
Common ancillary services:
- Laundry and ironing
- Extra-bed charges
- Early check-in / late check-out fees
- Airport or railway station transfers
- Travel desk commissions
- Parking fees
- Mini-bar or vending machine sales
- Conference room rental by the hour
- Spa and wellness services (in select properties)
For financial projections, ancillary income can be estimated as 3–8% of room revenue in basic models or via per-occupied-room assumptions. FHRAI data shows “Miscellaneous Income” at approximately 0.7% and “Other Operated Departments” at around 0.8% for small hotels – but properties with active travel desks, parking facilities or wellness services can push this higher.
An effective hotel revenue management strategy systematically captures all such income and minimises revenue leakage from unbilled services. Hotels can optimize strategies based on identified market segments – for instance, offering transfer services primarily to leisure travellers arriving by train while focusing on conference room rentals for corporate guests.
Comprehensive Illustrative Revenue Model – 20-Room Budget Hotel
Below is a cohesive hypothetical model for a 20-room budget hotel, bringing together all revenue heads.
Assumptions (Clearly Illustrative):
| Assumption | Value |
|---|---|
| Number of Rooms | 20 |
| Operating Days | 365 |
| Year 1 Occupancy | 50% |
| ADR | ₹3,200 |
| Available Room Nights | 7,300 |
| Occupied Room Nights | 3,650 |
Annual Revenue Summary:
| Revenue Head | Estimation Basis | Annual Revenue (₹) |
|---|---|---|
| Room Revenue | 3,650 × ₹3,200 | ₹1,16,80,000 |
| F&B Revenue | ~25% of room revenue | ₹29,20,000 |
| Other/Ancillary Income | ~5% of room revenue | ₹5,84,000 |
| Total Revenue | ₹1,51,84,000 |
These figures are illustrative and should not be treated as standard industry rates or guaranteed financial performance. Actual figures depend upon location, category, facilities, competition, operating strategy and market demand.
This total revenue figure is the starting point for deriving hotel EBITDA in the DPR. After deducting operating expenses (typically 52–65% of revenue for budget hotels based on industry benchmarks), the resulting operating surplus determines hotel business profitability and supports DSCR calculations for term-loan appraisal.
Analysing Revenue Mix – Rooms vs F&B vs Other Income
Total hotel revenue is the sum of room revenue, F&B revenue and other operating income. Understanding the revenue mix matters because it reveals business structure and risk concentration.
Two hotels with identical room counts can have very different turnovers. A 20-room property with an active restaurant and small banquet facility might generate ₹1.80 crore, while a 20-room lodging-only property in a quieter location might do ₹90 lakh. The difference comes from ADR, occupancy, F&B operations and ancillary services.
Small hotels can maximize profitability through a diversified revenue strategy. In pure lodging hotels, room revenue may form 85–90% of total revenue, while in hotels with active restaurants and events it might drop to 60–70%, with F&B filling the gap. Higher F&B and ancillary revenue can boost revenue per available room, but they also bring additional operational costs and management complexity that must be reflected in the P&L.
Monthly vs Annual Revenue – Seasonality & Cash Flow
Indian hotel demand is seasonal. Simply dividing annual projections by 12 gives a misleading picture for cash flow and working capital planning.
Practical examples of seasonality:
- Hill stations peak April–June, slow during monsoons
- Pilgrimage locations peak during specific festivals (Navratri, Char Dham season, Kumbh)
- Business cities are weaker in May, strong during corporate quarters
- Wedding months (November–February in North India) drive demand for rooms and events
Accurate forecasting helps anticipate high- and low-demand periods. Forecasting informs pricing strategies and inventory allocation, allowing hotels to adjust room rates and marketing spending month by month. Banks review cash-flow adequacy for each year, and understanding seasonal swings helps in planning working capital reserves for loan EMI payments during lean months.

Revenue Ramp-Up for New Small Hotels
A newly opened hotel requires a build-up period before achieving stable occupancy. Brand awareness, online reviews, corporate tie-ups and repeat business all take time to develop.
A conceptual progression:
- Soft opening months – occupancy 25–35%, heavy reliance on OTAs and introductory pricing
- First full year – occupancy 40–55%, stronger OTA presence, initial corporate inquiries
- Second year – occupancy 55–65%, better direct bookings, repeat guests, improved ratings
- Third year – approaching stabilised performance at 60–72%
Loyalty and repeat guests can contribute significantly to a hotel’s profitability over time. Hotels with higher direct bookings enjoy better guest relationships and lower acquisition costs. Presenting a realistic ramp-up path improves credibility of the DPR in the eyes of bankers, compared to flat high occupancy from day one.
Revenue Growth Assumptions – How Fast Can a Small Hotel Grow?
Revenue growth in small hotels typically comes from:
- Gradual occupancy improvement until market saturation
- Modest ADR increases in line with inflation and property upgrades
- Better online ratings and guest satisfaction driving repeat visits
- Corporate tie-ups and group contracts
- Expanded F&B sales and new revenue streams
- A strong online presence that increases direct bookings
Assumptions like 15–20% annual revenue growth over several years are usually viewed as aggressive unless backed by strong evidence (a new industrial zone, airport or tourist circuit nearby). Customer segmentation helps tailor marketing and pricing to distinct traveller groups, and segmentation helps hotels group guests by booking behavior to target the most profitable demand. Effective segmentation can increase revenue from targeted promotions, and segmentation allows hotels to identify high-value guest segments.
ADR escalation of 4–6% per annum and occupancy growth stabilising by Year 3–4 are generally more defensible assumptions. AI-powered tools enhance revenue management accuracy and speed, while modern forecasting tools incorporate AI and predictive analytics – but these should be presented as potential upsides, not guaranteed outcomes.
Operating Expenses – Connecting Revenue to Profit
Revenue is not profit. A hotel generating ₹1.50 crore in total revenue may retain only ₹40–55 lakh as operating surplus after covering all operational costs.
Key operating cost heads for small hotels:
- Salaries and wages (often 20–30% of revenue)
- Housekeeping and linen
- Electricity and water (significant for AC-dependent properties)
- Food and beverage cost (raw materials, typically 30–40% of F&B revenue)
- OTA commissions (15–25% of OTA-driven room revenue)
- Repairs, maintenance and upkeep
- Marketing and distribution strategies
- Internet, software subscriptions and an integrated PMS that improves communication and data access across departments
- Property taxes, licenses and insurance
- Administrative expenses
Increasing direct bookings can boost hotel profitability significantly because it reduces the commission paid to third party platforms. Some costs are mostly fixed (minimum staffing, base utilities, insurance), while others are variable with occupancy (laundry, food material, room supplies). This distinction is at the heart of yield management thinking.
Bankable hotel projected profit and loss statements should show operating expenses linked logically to revenue. Better revenue management tools and dynamic pricing can increase revenue per available room without proportionately increasing costs, thereby improving hotel EBITDA.
From Total Revenue to GOP & EBITDA
Here is how total revenue flows to profitability in simple terms:
Total Revenue – Operating Expenses (excluding interest, depreciation & tax) = EBITDA
Hotels also track gross operating profit (GOP) and GOPPAR (Gross Operating Profit per Available Room) as performance indicators. For the 20-room illustrative model:
| Particular | Amount (₹) |
|---|---|
| Total Revenue | ₹1,51,84,000 |
| Operating Expenses (~60%) | ₹91,10,400 |
| EBITDA | ₹60,73,600 |
| EBITDA Margin | ~40% |
Budget hotels in India show GOP margins of approximately 35–48% according to BrandSync benchmarks. Lenders pay close attention to sustainable EBITDA levels because interest, principal repayment and future capital expenditure must all be serviced from cash accrual. Hotel revenue and financial projections should avoid artificially inflating revenue or underestimating costs merely to create a higher EBITDA on paper.
Break-Even Occupancy – How Many Rooms Must You Sell?
Break-even occupancy is the occupancy rate at which total contribution from rooms, F&B and other income covers all operating fixed costs, before interest and loan repayment.
Simple steps to estimate:
- Calculate total fixed monthly expenses (salaries, rent, base utilities, insurance, etc.)
- Estimate variable cost per occupied room (linen, cleaning supplies, toiletries, incremental electricity)
- Calculate contribution per occupied room = ADR – variable cost per room + proportional F&B contribution
- Break-even rooms per month = Fixed expenses ÷ Contribution per occupied room
- Break-even occupancy = Break-even rooms per month ÷ Available rooms per month
For a small hotel with ₹4 lakh monthly fixed costs, ₹700 variable cost per room and ₹3,200 ADR with ₹400 average F&B contribution per occupied room, the contribution per room is ₹2,900. Break-even rooms = 4,00,000 ÷ 2,900 ≈ 138 rooms per month, or approximately 23% occupancy for a 20-room hotel.
This looks comfortable – but once you add interest and EMI payments, the effective break-even climbs significantly. Lenders check whether projected occupancy comfortably exceeds this level, leaving margin for demand fluctuations.
Linking Revenue Model with Project Cost & Investment Size
Revenue-generating capacity should guide the scale of project cost, not the other way around. A very high investment for a location that supports only modest ADR and occupancy can strain DSCR beyond acceptable levels.
The prudent approach: first estimate realistic stabilised annual revenue and EBITDA, then work backwards to see what level of project cost and debt the property can safely support. Promoters interested in detailed investment planning can refer to the dedicated resource on Small Hotel Setup Cost in India, where hotel setup cost for 10, 20 and 30 rooms is discussed in depth.
Feasible alignment between revenue potential and total project cost is critical for long-term hotel loan repayment capacity.
Revenue Model, FF&E Quality & Room Tariff Positioning
The level of investment in hotel furniture, fixtures and equipment (FF&E) directly influences guest experience, market positioning and achievable ADR. Better beds, high-quality linen, efficient air-conditioning, smart TVs and well-designed bathrooms can justify a higher average room rate in hotel and attract stronger guest segments. Evolving guest expectations mean that what passed as adequate five years ago may feel dated today.
Conversely, inadequate FF&E may force the hotel to charge lower tariffs, reducing total revenue and potentially impacting DSCR even if occupancy is decent. Guest data and feedback consistently show that room quality is among the top factors influencing booking decisions and willingness to pay.
Promoters who want a structured capex list can refer to Small Hotel Equipment, Furniture & FF&E List with Cost, which details hotel equipment and furniture requirements and their cost impact. In a DPR, projected ADR and revenue per available room must be consistent with the standard of FF&E being proposed in the project cost.
Revenue Model, Means of Finance & Loan Servicing
Projected revenue flows into operating surplus, which then supports interest, loan instalments and returns to promoters. This chain forms the backbone of hotel DSCR analysis:
Project Cost → Means of Finance (Promoter Equity + Term Loan) → Operating Revenue → EBITDA → Cash Accrual → DSCR
Too much debt on a modest revenue base depresses DSCR. In one published budget hotel analysis, a project with 55% occupancy and ADR of ₹4,200 saw DSCR drop to approximately 1.15 on a ₹14 crore loan – below the typical bank comfort level of 1.50.
Readers needing a structured view of funding options can refer to Small Hotel Project Cost & Means of Finance. Hotel revenue projection for bank loan must show that debt-servicing can be met even under slightly adverse scenarios, not just best-case revenue outputs.
Revenue Projections Inside a Hotel DPR / Project Report
The revenue model forms the core of projected profit and loss account, cash flow statement and projected balance sheet in a small hotel DPR. Room, F&B and ancillary revenue feed into monthly and annual P&L, from which operating profit, interest, depreciation, tax and net profit are derived.
Cash flow projection uses revenue and collection assumptions to verify whether liquidity is sufficient for EMI payments during all months, considering seasonality. Revenue management systems help forecast demand using historical data, making monthly cash flow projections more reliable as the hotel builds an operating track record.
Break-even analysis, hotel DSCR and working capital assessment all rely on the quality of top-line revenue assumptions. As a CA, I typically cross-check revenue assumptions with local data, existing hotels and the promoter’s own experience before finalising a DPR for submission to banks.
What Banks & Lenders Look For in Hotel Revenue Projections
Lenders examine hotel revenue projections with a specific checklist:
- Location and catchment area – demand potential, accessibility, tourism data
- Number of rooms and proposed tariff slab – is the ADR consistent with the hotel category?
- Expected occupancy – does it match competitor performance and market demand?
- Restaurant/banquet presence – is F&B revenue supported by actual infrastructure?
- Promoter background – relevant experience in hospitality or business management
- Revenue diversification – does the hotel rely only on rooms or are there multiple revenue streams?
- Operating costs and DSCR – can the projected cash accrual comfortably service the loan?
Banks scrutinise whether revenue assumptions are internally consistent. Effective demand forecasting can improve revenue management decisions, and lenders appreciate when projections reflect demand forecasting that uses historical data and real-time signals rather than optimistic guesses.
No specific ratio or DSCR automatically guarantees loan sanction, but reasonable, well-justified assumptions significantly improve the project’s acceptability during appraisal.
Sensitivity Analysis – Testing the Revenue Model Under Stress
Sensitivity analysis checks how changes in key variables affect revenue, EBITDA, cash accrual and DSCR. It is among the most important sections in a professional hotel DPR.
Practical scenarios to test:
| Scenario | Impact Area |
|---|---|
| Occupancy 10% below projection | Room revenue drops, DSCR weakens |
| ADR 5–10% lower than assumed | Revenue per available room falls |
| F&B revenue 20% below expectation | Total revenue and EBITDA reduce |
| Operating expenses 10% higher | Profit margins compress |
Each scenario should be run through the financial model to check whether term-loan EMIs can still be serviced. Presenting such scenarios upfront signals maturity to bankers, differentiating the proposal from generic, optimistic projections. Modern RMS can apply dynamic pricing strategies in real-time to respond to adverse market trends, but the DPR should show viability even without such optimistic interventions.
Common Mistakes in Small Hotel Revenue Projections
Frequent errors that weaken a hotel project report:
- Assuming 80–100% occupancy from day one – unrealistic for any new hotel
- Using peak-season tariff as year-round ADR – ignores off-peak discounting
- Ignoring OTA commissions – direct bookings may be limited initially
- Omitting ramp-up period – banks will question immediate stabilisation
- Overestimating banquet income without infrastructure – no hall means no banquet revenue
- Confusing rack rate with realised ADR – published tariff is never fully realised
- Treating revenue as profit – ignoring operational costs and debt servicing
- Using identical occupancy assumptions for every location – a highway motel and a city hotel have different demand profiles
- Not accounting for free rooms, upgrades or discounts – these reduce effective ADR
- Underestimating food cost in F&B projections – raw material typically runs 30–40% of F&B revenue
These mistakes inflate total revenue and hotel EBITDA on paper but result in cash-flow stress and lower-than-planned DSCR in reality. A strong hotel revenue model is one that can be defended with data and logic, not one that merely produces attractive figures in Excel.
Comparative Example – 10-Room vs 20-Room vs 30-Room Hotel
| Particular | 10-Room Hotel | 20-Room Hotel | 30-Room Hotel |
|---|---|---|---|
| Available Room Nights | 3,650 | 7,300 | 10,950 |
| Illustrative Occupancy | 45% | 50% | 60% |
| Occupied Room Nights | 1,643 | 3,650 | 6,570 |
| Illustrative ADR (₹) | 2,500 | 3,200 | 3,800 |
| Annual Room Revenue (₹) | 41.07 lakh | 1.168 crore | 2.497 crore |
| F&B Revenue (~25% of room) | 10.27 lakh | 29.20 lakh | 62.43 lakh |
| Other Income (~5% of room) | 2.05 lakh | 5.84 lakh | 12.49 lakh |
| Total Revenue (₹) | 53.39 lakh | 1.518 crore | 3.244 crore |
All figures are illustrative examples only – not industry benchmarks or guarantees.
Larger hotels may achieve better cost ratios, more revenue opportunities and stronger economies of scale, but they require higher investment and more capable management. A small 10-room property can still be viable in niche locations – pilgrimage towns, tourist routes, near hospitals – if the revenue model, management strategies and cost control are handled carefully. Promoters should adapt this logic to their own location rather than copy sample numbers.

Practical CA Perspective – Building Defensible Revenue Assumptions
In my practice preparing hotel project reports and CMA data, I evaluate revenue assumptions by asking a simple question: can the promoter explain why these numbers are achievable?
Occupancy, ADR, F&B and ancillary figures are cross-checked with market data, competitor pricing available on OTAs, client discussions and sometimes physical site visits. Predict future trends by analysing local development plans, upcoming infrastructure and tourism projections – but ground every assumption in present-day reality first.
Internal consistency is non-negotiable. Room capacity must align with projected revenue, which must align with operating expenses, which must produce enough cash accrual to service the proposed term loan at a comfortable DSCR. If any link in this chain breaks, the entire DPR loses credibility.
I encourage promoters to focus on how to genuinely increase hotel revenue – through better online presence, dynamic pricing strategies, effective upselling, stronger corporate tie-ups and genuine ancillary services – rather than just inflating figures in spreadsheets. Revenue management is about maximizing revenue from existing capacity, not about fantasy arithmetic. A good hotel DPR explains the “why” behind numbers so that both the promoter and banker can trust the revenue model over the long term. The hotel’s revenue goals should be ambitious but grounded, reflecting the guest journey from discovery to check-out and the revenue potential at each touchpoint.
Dedicated revenue teams may be a luxury for large hotels, but even a small hotel promoter who understands revenue management opportunities – monitoring competitor pricing, adjusting room rates for peak demand periods, tracking data analysis on booking patterns – will run a materially more profitable operation.
FAQs on Small Hotel Revenue Model & DPR Projections
These FAQs address practical doubts frequently raised by promoters while planning small or budget hotels in India. The answers supplement the detailed explanations provided in the main sections above.
What is a realistic way to estimate revenue for a 20-room hotel in India?
Start with Annual Available Room Nights = 20 × 365 = 7,300. Apply a realistic Year 1 occupancy based on your location – perhaps 45–55% for a new budget property. Use a market-backed ADR, say ₹2,200–₹3,200 for a budget hotel, clearly understood as location-dependent.
Calculate room revenue from this base, then add F&B and ancillary income using conservative percentages or per-guest spend assumptions aligned with your actual facilities. Validate ADR and occupancy by checking rates and reviews of comparable hotels on OTAs and Google rather than relying only on optimistic expectations.
How can small hotels use dynamic pricing without complex software?
Even without full-fledged revenue management tools, a small hotel can define seasonal rate slabs (peak, shoulder, off-peak) and adjust prices for weekends, local events and last-minute demand. Modern RMS can apply dynamic pricing strategies in real-time, but even simple spreadsheets tracking booking pace, cancellation patterns and average spend can already improve yield management compared to fixed pricing.
Monitor competitor rates on major online travel agencies weekly, then adjust your own tariffs within reasonable limits. This simple practice of managing inventory and pricing responsively is the foundation of revenue management for independent hotels.
Is it safe to assume a fixed percentage of room revenue for F&B in projections?
While many basic models assume F&B as a percentage of room revenue (for example 20–40%), this should be treated only as an approximation for early planning. For a final DPR, F&B revenue should be estimated from operational logic – covers per day, average bill value, local demand, seating capacity – to align more closely with actual business conditions.
Overestimating F&B can make a hotel revenue model look attractive on paper but lead to disappointment if local walk-in demand or guest experience expectations differ from assumptions. Remember that roughly 40% of incremental hotel revenue growth comes from non-room categories, so getting F&B right matters enormously.
What occupancy level is considered good for break-even in a small hotel?
There is no single “good” occupancy valid for all hotels. Break-even occupancy depends on ADR, cost structure, F&B contribution and financing terms. A property with high fixed costs and heavy debt will need higher occupancy to break even compared to a lean, owner-managed hotel with modest borrowing.
Work with your CA to calculate specific break-even occupancy for your project. Planning for occupancy well above break-even – with a safety margin of at least 10–15 percentage points – is prudent because actual performance may fluctuate due to seasonality, competitive pressure and unforeseen events. Forecast demand carefully and build contingency.
How should revenue be projected for a bank loan if the hotel is still only on paper?
Base projections on comparable operating hotels in similar locations and categories, supported by online research, discussions with local stakeholders and practical understanding of future demand drivers. Banks accept projections based on reasoned assumptions, not guesses. Each key input – rooms, occupancy, ADR, F&B, ancillary services – should be explained in notes accompanying the financial projections.
Keep projections moderate. Incorporate ramp-up in the first 2–3 years. Complement projections with sensitivity analysis showing that even if revenue per available room or total revenue is somewhat lower than expected, loan obligations can still be met. This approach demonstrates anticipate future demand thinking without over-promising, and helps drive revenue growth through credibility rather than fantasy.
Professional Assistance for Small Hotel DPR, Projections & Bank Finance
Preparing a realistic, defensible small hotel revenue model is critical for both internal decision-making and bank appraisal. The revenue assumptions you present in your DPR determine whether lenders view your project as viable – and whether you yourself can be confident about the investment.
CA Manish Gugliya, through ProjectReportBank.com, assists promoters with hotel DPRs, project reports, CMA data, hotel revenue and financial projections, break-even and DSCR analysis – particularly for small and budget hotels in India. Services typically cover project cost estimation, means of finance structuring, detailed revenue assumptions (rooms, F&B, ancillary), operating expenses, projected P&L, cash flow and sensitivity analysis.
While professionally prepared reports strengthen a loan proposal, no assurance of bank sanction is provided – final approval always depends on the lender’s independent assessment and policies. Serious entrepreneurs, borrowers and consultants are welcome to reach out via ProjectReportBank.com with basic project details (location, number of rooms, facilities planned) to discuss tailored DPR requirements.
Explore More Small Hotel Project Report Guides
Continue exploring our Small Hotel DPR guides covering setup cost, equipment, project cost, revenue, financial projections, occupancy, feasibility, project finance and bank loan assessment.