
Key Takeaways
- Instant poha profitability is not a single number; it shifts with raw-material prices, selling price, packaging cost, product mix, capacity utilisation and distribution model. A 1,000 kg/day plant running at 60% utilisation produces a very different return than the same plant at 85%.
- Instant poha plant profit margin in India can range widely; branded retail poha typically achieves a net margin of 16-22%, while export-grade poha commands 24-32%. Value-added products with scaled production can see gross margins of 40-55%.
- A bankable detailed project report with integrated projected Profit & Loss, Cash Flow, Balance Sheet, break-even analysis and DSCR calculation is essential for term-loan sanction and working-capital facilities from Indian banks.
- Instant poha working capital; covering inventory, receivables, creditors and cash buffer; often determines whether a unit with good accounting profit can actually meet loan instalments and operate without disruption.
- Project Report Bank, led by CA Manish Gugliya, prepares customised instant poha project financials, CMA data and working-capital assessments aligned with Indian MSME banking norms.
Introduction: How to Think About Instant Poha Profitability
Many entrepreneurs evaluating an instant poha business idea begin by comparing raw-material cost per kg against the printed MRP of a retail pack. That comparison misses most of what determines whether the project is a profitable business. A proper assessment must integrate installed capacity, capacity utilisation, product mix, net selling price (after trade margins), raw material cost, packaging, labour, power, fuel, interest on term loan and working capital, depreciation, tax and the actual cash flow available for debt servicing.
Instant poha is a value-added product built on a base of flattened rice. The addition of seasoning premixes, dehydrated vegetables, spices like mustard seeds and cumin, branded packaging and convenient formats (cups, pouches) changes both the cost structure and the profit potential compared to plain beaten rice. Health-conscious consumers view poha as a light and easily digestible option compared to processed snacks, and instant poha requires minimal preparation time, appealing to busy professionals and students. In India, the packaged food market is expanding rapidly due to busy lifestyles seeking quick meal solutions, and this demand pulls instant poha into a growth category.
A detailed project report is more reliable than generic online margin calculators, especially when preparing a bank term-loan or cash-credit proposal. The global poha market was valued at $1.8 billion in 2025 and is projected to reach $3.1 billion by 2034, with Asia Pacific accounting for approximately 68.7% of global poha revenues. These numbers confirm market demand, but converting that demand into actual instant poha manufacturing profit requires a structured financial model.
In my practice since 2006, I have prepared DPRs, financial projections and CMA data for dozens of food-processing projects across India. This article walks through instant poha project financials, financial projections and working capital planning in the Indian context. All figures used are illustrative assumptions; your actual project must be modelled on its own capacity, location, product mix and funding structure.
Understanding the Revenue Model of an Instant Poha Plant
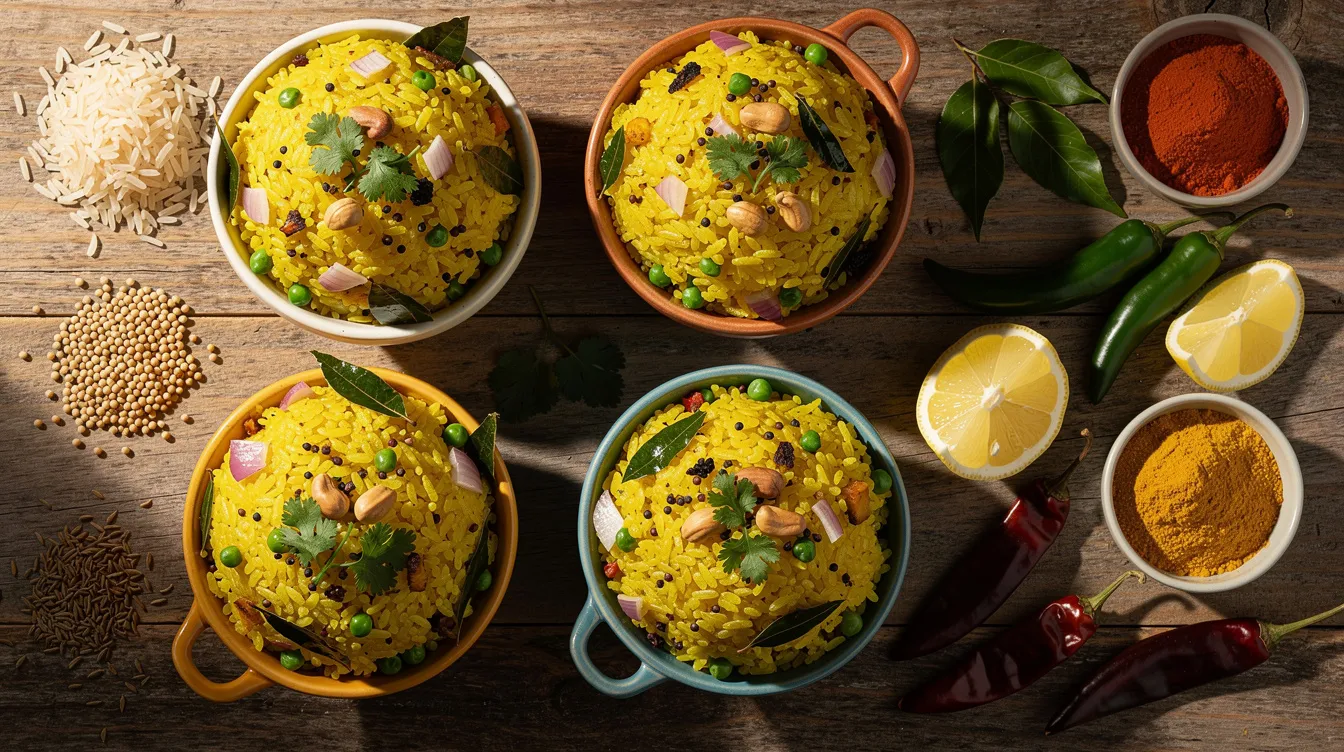
Annual revenue in an instant poha plant is derived from three variables: installed capacity, working days and capacity utilisation. For example, a plant with a daily production capacity of 1,000 kg, operating 300 days per year, has an installed capacity of 300 tonnes per year. At 70% utilisation, it produces 210 tonnes of output before accounting for process losses.
Converting technical capacity into saleable production requires subtracting process loss. In poha processing, yield from raw material is typically 70-75%, with additional losses from broken flakes, seasoning variation and packing rejects. The Instant Poha manufacturing process and production line article covers how each processing stage affects yield. Dehydrated instant poha mixes have extended shelf life when packaged properly, but off-spec batches reduce saleable quantity.
For instant poha financial projections, use “net realisation per kg” rather than printed MRP. If the MRP is ₹60/kg, the net realisation after retailer margin (say 20%), distributor margin (say 10%), GST impact and promotional schemes may drop to ₹42-48/kg. Revenue streams typically include branded B2C pouches (70 g, 200 g, 500 g), single-serve cups, economy family packs, institutional bulk packs and private-label manufacturing for modern trade chains.
The core formula is: Annual Net Sales = Saleable Production (kg) x Average Net Realisation (₹/kg). This feeds directly into the projected Profit & Loss Account.
Capacity Planning and Utilisation Ramp-Up
No realistic instant poha plant operates at 100% capacity from Day 1. Market development takes time; distribution channel onboarding, retailer listing, brand awareness and production learning curves all constrain early-year volumes. Approximately 42% of urban South Asian consumers buy packaged poha weekly, confirming demand potential, but capturing that demand requires months of execution.
An illustrative ramp-up for a new unit might look like:
- Year 1: 50-60% capacity utilisation
- Year 2: 70-75%
- Year 3 onward: 80-85%, stabilising at 85-95% by Year 5
These assumptions must reflect the specific business plan, promoter experience and regional demand. Higher automation level on the line (continuous roasters, inline seasoning mixers, automatic pouch packing) supports better uptime and lower unit operating cost, which improves fixed-cost absorption.
Capacity decisions should align with Instant Poha plant capacity, land, layout and utilities planning so that financial projections correctly reflect installed tonnage and utility cost. When capacity utilisation stays below break even (often around 50-55% for food-processing MSMEs), fixed costs per kg remain high and instant poha plant profitability suffers.
Product Mix, Pack Sizes and Selling Price Assumptions
Instant poha business profitability depends on the mix between plain poha, masala poha, vegetable variants, health-oriented versions like fortified poha and organic poha, and ready-to-eat meal cups. White poha holds 54.3% market share in 2025. Red poha has an 18.6% market share and grows at 7.1% CAGR. Organic poha accounts for 14.8% of the market and commands a 30-40% price premium over white poha. Fortified poha is the fastest-growing segment at 9.4% CAGR.
Value-added SKUs (e.g., 70 g masala cups, 200 g veggie pouches, premium variants) achieve higher net realisation per kg but also carry higher seasoning, packaging and marketing costs. The Instant Poha raw material, seasoning and product mix article explains how spices, oil, dehydrated vegetables and flavour profiles drive both cost and selling price.
Pack sizes affect contribution per kg. Single-serve cups and small pouches carry higher packaging cost per kg; moving to 200-500 g retail packs or 5-10 kg institutional packs lowers per-kg packaging cost but may require different distribution channels.
Pricing channels to weight in financial projections:
- General trade (cash or short credit, moderate margin)
- Modern trade and supermarkets (longer credit, listing fees)
- Institutional buyers (bulk, lower price, predictable volume)
- Private-label manufacturing (lower margin, stable orders)
- E-commerce and D2C platforms (higher visibility, platform fees of 10-20%)
Online retail for poha is growing at a CAGR of 9.8% through 2034, and the growth of e-commerce and quick commerce platforms facilitates easier market entry for instant poha brands. The overall average selling price in instant poha financial projections must be a weighted average across all active channels.
Major Cost Components in Instant Poha Manufacturing
Instant poha manufacturing profit margin is determined by how effectively each operating cost head is controlled, not only by the spread between flattened rice cost and selling price. The major cost heads are:
- Raw materials (including seasoning ingredients)
- Packaging materials
- Power and fuel
- Labour and salaries
- Repairs and maintenance
- Selling and distribution expenses
- Administrative overheads
These costs are taken on an annual basis in the projected Profit & Loss Account and are also central to working-capital and cash-flow planning. The volatility of flattened rice and raw paddy prices can alter instant poha gross profit and net profit from year to year. Profitability varies based on procurement efficiency and market demand in each region.
Raw Material and Seasoning Cost Structure
Core ingredients for an instant poha mix include flattened rice (rice flakes), spices (mustard seeds, chilli, cumin), seasoning premixes, dehydrated vegetables, peanuts, edible oil, salt, sugar and acidity regulators. When preparing masala variants, you add mustard seeds, curry leaves and turmeric to the pre-mixed seasoning; each ingredient contributes to cost per kg.
Instant poha has low raw material costs due to the abundance of paddy in major rice-producing regions of India. Paddy purchase price ranges from ₹18-28/kg depending on variety, state and season, with post-harvest months (October to February) offering the lowest rates. Yield from paddy to finished flattened rice is approximately 70-75%; the remainder is husk, bran, broken portions and moisture loss.
Raw-material consumption norms (kg of each input per 1,000 kg of instant poha) must be defined in the technical DPR and feed correctly into instant poha project financial analysis. Seasoning and premium ingredients typically add ₹2-5/kg over plain poha raw-material cost. A 10% increase in paddy price can add approximately ₹3.14 per kg to the cost of production; on annual volumes of 3,000 tonnes, that translates to nearly ₹94 lakh in additional cost.
Raw material cost is usually the largest element under cost of goods sold, forming 55-65% of total cost for instant poha, and directly affects contribution margin and gross profit.
Packaging Cost and Its Influence on Margin
Typical packaging options for instant poha include laminated pouches (3-layer BOPP/Poly), duplex cartons, printed cups with lids, shrink wraps and outer corrugated cartons for transport. Proper moisture-barrier packaging allows instant poha to be stored and shipped over longer distances without spoilage, and packaging innovation can extend shelf life, reducing waste. Effective branding and packaging can justify premium pricing for instant poha products.
For small consumer SKUs, packaging cost per kg can equal or exceed seasoning cost. Consider:
- 70 g cup: packaging cost may be ₹4-6 per kg of product
- 200 g pouch: packaging cost drops to approximately ₹2-4 per kg
- 1 kg bulk pack: packaging cost may be ₹1-2 per kg
The contribution per kg improves when moving to larger packs at the same net realisation. Consumer demand for instant poha is driven by urban lifestyles and the need for convenient meals, so single-serve formats may justify their higher packaging cost through higher retail prices.
Packaging-inventory holding (printed material, cups, cartons) adds to instant poha working capital requirement and must be built into the detailed project report. Premium packaging for export or modern trade raises cost but can offer higher net selling prices; the profitability analysis should compare both scenarios.
Power, Fuel, Labour and Overheads
The chosen line configuration (electric vs gas-fired roasters, automation level, continuous or batch systems) determines per-kg power and fuel consumption. Investment in energy-efficient processing can improve yield and reduce costs in instant poha manufacturing. Units using biomass or rice husk as fuel operate at lower thermal-energy cost than those running on LPG or electricity alone.
Major manpower categories include machine operators, helpers, packaging staff, quality control, supervisors, maintenance, sales executives and office administration. For a small-to-mid instant poha plant (1-2 tonnes/day), labour is largely semi-skilled, but supervision and QC require experienced staff to avoid rejections and customer complaints.
Typical overheads include repairs and maintenance, insurance, statutory compliance (GST registration, FSSAI basic registration, trade licence), rent (if applicable), communication, accounting and professional fees, and local transport. In instant poha financial projections, these items are mostly fixed or semi-fixed, which means they strongly influence the break-even analysis and DSCR.
Selling, Distribution and E-Commerce Costs
Common distribution structures in India include the distributor-retailer model, direct supply to supermarkets and institutional buyers, mid day meal schemes and other government contracts, and online D2C sales via marketplaces. Distributor and retailer margins, promotional schemes, listing fees, freight and e-commerce commissions must all be subtracted from MRP to arrive at net realisation.
Expansion into e-commerce can raise brand visibility, especially in southern India and diaspora markets (Middle East, Indian diaspora communities abroad), but involves higher marketing spends and platform fees. These costs must be considered while assessing instant poha business profit margin.
A short comparison: B2B bulk sales to institutional buyers may yield a lower net realisation per kg but involve minimal selling cost (perhaps 2-3% of sales); branded retail packs through distributors may yield higher realisation but carry 15-25% in combined distribution, promotion and trade margins. All selling and distribution expenses appear below gross profit in the projected Profit & Loss Account and influence EBITDA and net profit. They also affect working capital through receivable cycles that can stretch to 30-60 days for modern trade and institutional buyers.
Manufacturing Process Efficiency and Impact on Profitability
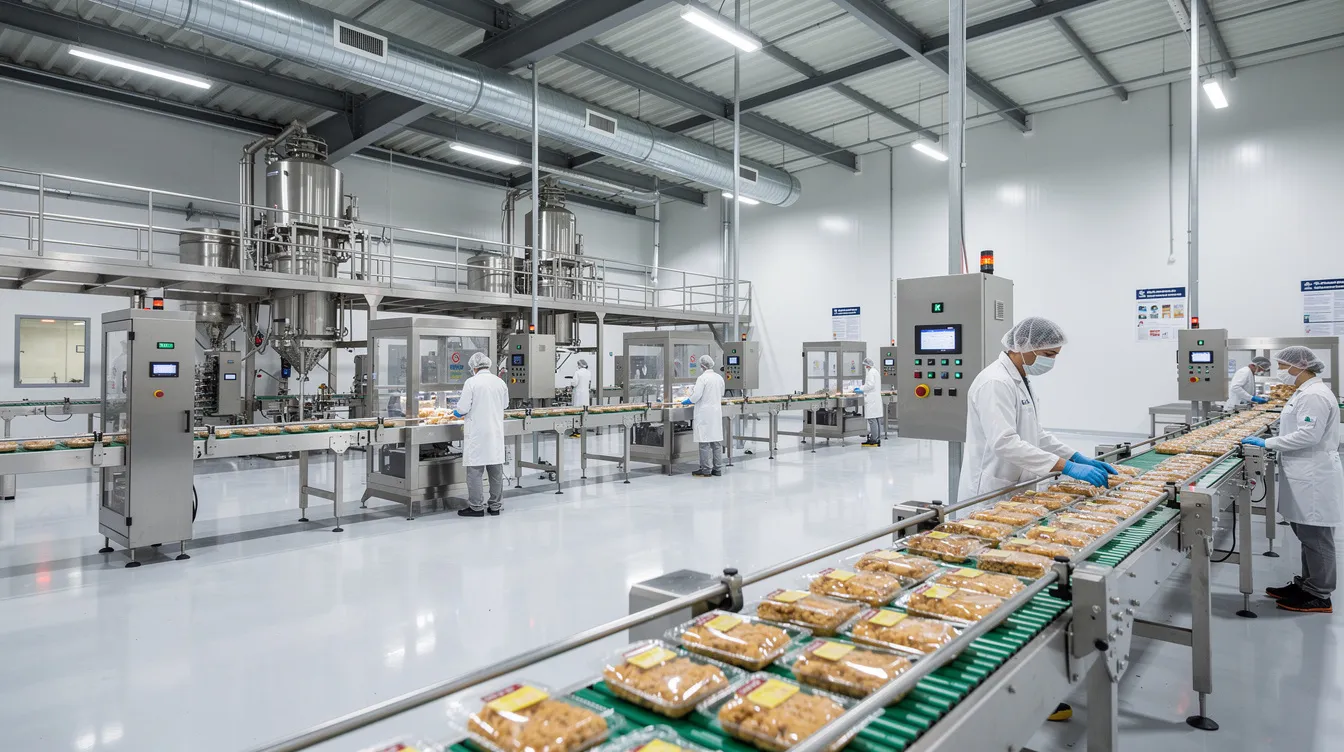
Process steps in instant poha production; roasting, seasoning, mixing, drying, cooling and packing; must be balanced for yield, wastage and quality consistency. Higher process loss from broken flakes, seasoning variation or off-spec batches directly reduces saleable output and instant poha manufacturing profit per kg.
The detailed guide on the Instant Poha manufacturing process and production line covers technical specifications. In financial projections, realistic process-loss percentages (typically 2-5% beyond standard paddy-to-poha yield loss) must be used, and these should be consistent across the DPR, CMA data and working-capital calculations.
Better quality control at checkpoints (moisture measurement, seasoning weight, seal integrity) improves customer retention and product quality over time. Managing waste and inventory is crucial to maintain margins in the instant poha market due to its shelf-stable nature. The profitability of instant poha relies on efficient supply chains and long shelf-life capabilities.
Machinery Investment, Depreciation and Financing Structure
Key equipment required for an instant poha and ready-to-cook rice products line includes raw-material handling systems, roasting units, seasoning mixers, blending equipment, pouch or cup packing machines and check-weighers. The Instant Poha and ready-to-cook rice products machinery and equipment article covers technical specifications and approximate costs.
A 500 kg/day poha unit may require ₹5-10 lakh for machinery alone, while a poha manufacturing unit at commercial production scale can be set up for ₹8-30 lakh total. Higher automation increases initial project cost but usually improves consistency, throughput and per-person productivity, which can enhance overall instant poha plant profitability.
Fixed-asset investment appears in the project cost, financed partly by term loan and partly by promoter contribution. Assets are depreciated over useful life in the projected Profit & Loss Account. Depreciation is a non-cash expense; it reduces accounting profit but not cash profit, which is directly relevant for DSCR and loan repayment capacity assessment.
Illustrative Profitability Statement for an Instant Poha Plant
The following table illustrates a single stabilised year for a 1,000 kg/day plant at approximately 75% capacity utilisation and an assumed average net realisation of ₹55/kg. All values are examples only and must be customised for each DPR.
| Particulars | Illustrative (₹ Lakh/Year) | Approx. % of Sales |
|---|---|---|
| Net Sales | 123.75 | 100% |
| Raw Material Cost | 68.06 | 55% |
| Packaging Cost | 9.90 | 8% |
| Power & Fuel | 6.19 | 5% |
| Employee Cost | 8.66 | 7% |
| Repairs & Maintenance | 1.86 | 1.5% |
| Selling & Admin Expenses | 7.43 | 6% |
| EBITDA | 21.65 | 17.5% |
| Depreciation | 3.50 | 2.8% |
| Interest (TL + WC) | 4.20 | 3.4% |
| Profit Before Tax | 13.95 | 11.3% |
| Tax (estimated) | 3.49 | 2.8% |
| Profit After Tax | 10.46 | 8.5% |
A ₹2/kg change in net realisation or raw-material cost on 225 tonnes of saleable output shifts EBITDA by approximately ₹4.5 lakh per year. That single variable can move instant poha plant net profit by 30-40% in either direction.
Cash accrual (PAT + Depreciation) in this example is approximately ₹13.96 lakh, which is the amount available for term-loan repayment. This profitability snapshot must align with the multi-year instant poha plant financial projections prepared for bank appraisal.
Understanding Gross Profit, EBITDA, Net Profit and Cash Accrual
Gross profit (or gross contribution) is Net Sales minus variable manufacturing costs (raw material, packaging, direct power and fuel). EBITDA is gross profit minus fixed operating costs (salaries, overheads, selling expenses) but before interest, tax, depreciation and amortisation. EBIT removes depreciation. Profit Before Tax removes interest. Profit After Tax removes income tax.
“Cash profit” or “cash accrual” equals Profit After Tax plus Depreciation. Lenders focus on cash accrual for instant poha DSCR and loan repayment capacity because depreciation is an accounting charge, not a cash outflow.
Instant poha business profitability should not be judged solely on EBITDA percentage. Two plants with the same EBITDA can have very different net profit and DSCR:
- Plant A: EBITDA ₹20 lakh, low debt, interest ₹2 lakh; net profit ₹12 lakh
- Plant B: EBITDA ₹20 lakh, high debt, interest ₹8 lakh; net profit ₹6 lakh
Plant B’s DSCR may fall below acceptable levels despite identical operating performance. All these metrics should appear consistently in the instant poha project report financial projections and CMA data submitted to banks.
Instant Poha Plant Profit Margin and Return Metrics
Instant poha plant profit margin in India varies with selling price, brand strength, distribution model, scale of operations, raw-material sourcing and packaging strategy. Instant poha can command higher retail prices compared to bulk poha due to value addition through flavoring and packaging. Profit margins for instant poha can range from 40% to 55% for value-added products once production scales. Branded retail poha has a net margin of 16-22%. Export-grade poha commands a net margin of 24-32%.
Three distinct return metrics matter:
- Margin on sales (EBITDA % or net profit %)
- Return on Capital Employed (ROCE): operating profit divided by total capital employed
- Return on promoter equity: net profit divided by promoter’s own investment
High-looking percentage margins on small-scale units may still yield low absolute profits if capacity is tiny. Conversely, moderate margins on large tonnage generate substantial cash accrual. Banks typically examine profitability alongside DSCR, debt equity ratio and current ratio to judge overall financial viability. I do not recommend quoting a universal profit-margin figure; project-specific financial analysis is the only reliable approach.
Break-Even Analysis for an Instant Poha Plant
Break-even analysis separates fixed costs (salaries, rent, insurance, interest on term loan, basic overheads) from variable costs (raw materials, packaging, power, selling expenses) to find the point where total revenue covers total cost.
The formula: Break-Even Sales (₹) = Fixed Costs / Contribution Margin Ratio
If fixed costs are ₹10 lakh per year and the contribution margin ratio is 30%, break-even sales are ₹33.3 lakh. For a 225-tonne installed capacity plant, this might correspond to about 51% capacity utilisation, consistent with benchmarks for food-processing MSMEs.
In DPR assignments, break-even is normally shown for Year 1 through Year 5 alongside capacity-utilisation assumptions. Lenders and investors use break-even analysis to understand resilience against sales shortfall and to stress-test instant poha profitability. Poha manufacturing can achieve payback in 4-6 years depending on scale, product mix and market positioning.
Multi-Year Financial Projections in an Instant Poha DPR
A bankable instant poha DPR for bank finance generally contains at least 5 years of projections: Profit & Loss Account, Balance Sheet, Cash Flow Statement, key ratios and break-even analysis. These instant poha plant financial projections must be internally consistent, with assumptions flowing from installed capacity through to capacity utilisation, selling price, cost norms and working-capital cycle.
Ratio analysis (EBITDA margin, net margin, ROCE, current ratio, DSCR, interest coverage) validates whether projected performance is reasonable for a food-processing MSME. A project report is essential for bank loan applications, and a DPR follows a standardised format that most Indian banks expect.
The projected balance sheet captures fixed assets, inventory, receivables, cash, term loan outstanding and working-capital borrowing, and must reconcile with projected Profit & Loss and Cash Flow. Project Report Bank specialises in preparing integrated instant poha project financials and CMA data that align with typical Indian bank appraisal formats.
Projected Profit & Loss Account: Structure and Assumptions
The standard format runs:
Sales, Less Cost of Production (raw materials, packaging, power, wages) = Gross Contribution. Less Administrative and Selling Expenses = EBITDA. Less Depreciation and Interest = Profit Before Tax. Less Tax = Profit After Tax.
Sales growth each year should be driven by capacity-utilisation ramp-up and realistic price changes for instant poha products, not arbitrary double-digit growth percentages. Raw material and packaging cost percentages should reference current mandi prices for flattened rice and vendor quotations for spices and packaging. Certain cost ratios (power as % of sales, salary increments, marketing spends) should evolve realistically as the plant scales from Year 1 operations to stabilised commercial production.
This projected Profit & Loss forms the backbone for calculating instant poha gross profit, EBITDA, net profit and cash accrual for DSCR analysis.
Projected Balance Sheet and Capital Structure
Major asset heads include gross block of plant and machinery, building and other fixed assets (shown at net block after depreciation), plus current assets like inventory, receivables, cash and advances.
The liability side shows promoter equity, accumulated reserves, term-loan outstanding, working-capital borrowing (cash credit or OD), trade creditors and other current liabilities. Total assets must equal total liabilities plus equity. Every change in Profit & Loss or working-capital assumptions reflects in the balance sheet.
A realistic debt equity ratio (e.g., 1.5:1 to 3:1, depending on lender norms) is important for both bank comfort and sustainable instant poha project finance. Projected Balance Sheets feed into CMA data preparation and are used for assessing current ratio, inventory levels and receivable days.
Cash Flow Projection and Debt Servicing Capacity
A project can show accounting profit but still suffer cash shortages if working capital and loan-repayment schedules are not aligned with cash inflows. In project-finance assignments, I generally examine profitability together with working-capital requirements because a project showing accounting profit may still face liquidity pressure.
Operating cash flow is cash generated from operations before capital expenditure and financing. Investing cash flow covers capital expenditure. Financing cash flow includes term-loan drawdown, principal repayment, interest and promoter infusion. Instant poha projected cash flow statements help determine whether the plant can comfortably meet term-loan instalments and interest out of cash accrual.
The debt service coverage ratio (DSCR) is calculated from cash accrual rather than net profit alone. A DSCR below 1.0 indicates inability to pay debt from internal cash, which is a major concern for any lender evaluating instant poha project finance.
Working Capital in an Instant Poha Plant: Concept and Components
Working Capital = Current Assets minus Current Liabilities. In practical terms, it represents the cash tied up in day-to-day instant poha plant operations between purchasing raw material and collecting sales proceeds.
Major current-asset components:
- Raw-material inventory: flattened rice, spices, oil, dehydrated vegetables
- Packaging material: pouches, cups, cartons, labels
- Work-in-process: limited in continuous operations but still present
- Finished-goods stock: required for distributor supply, warehousing, e-commerce fulfilment, institutional orders
- Receivables: amounts owed by distributors, supermarkets, institutional buyers and private-label customers
- Minimum cash balance: for payroll, utilities and contingencies
Major current-liability components include trade creditors for raw materials and packaging, other payables and short-term bank borrowing (cash-credit limits).
Working capital for an instant poha plant is generally financed through a mix of promoter margin and bank working-capital facilities. In many project-finance assignments, I have seen instant poha working capital underestimated, creating operational stress despite good nominal profitability.
Working Capital Cycle and Inventory/Receivable Planning
The operating cycle runs: purchase of raw material, processing, finished goods in store, sales to distributor, receivables, cash collection. Each stage consumes a certain number of days.
Typical inventory norms for instant poha units (illustrative, actual figures vary):
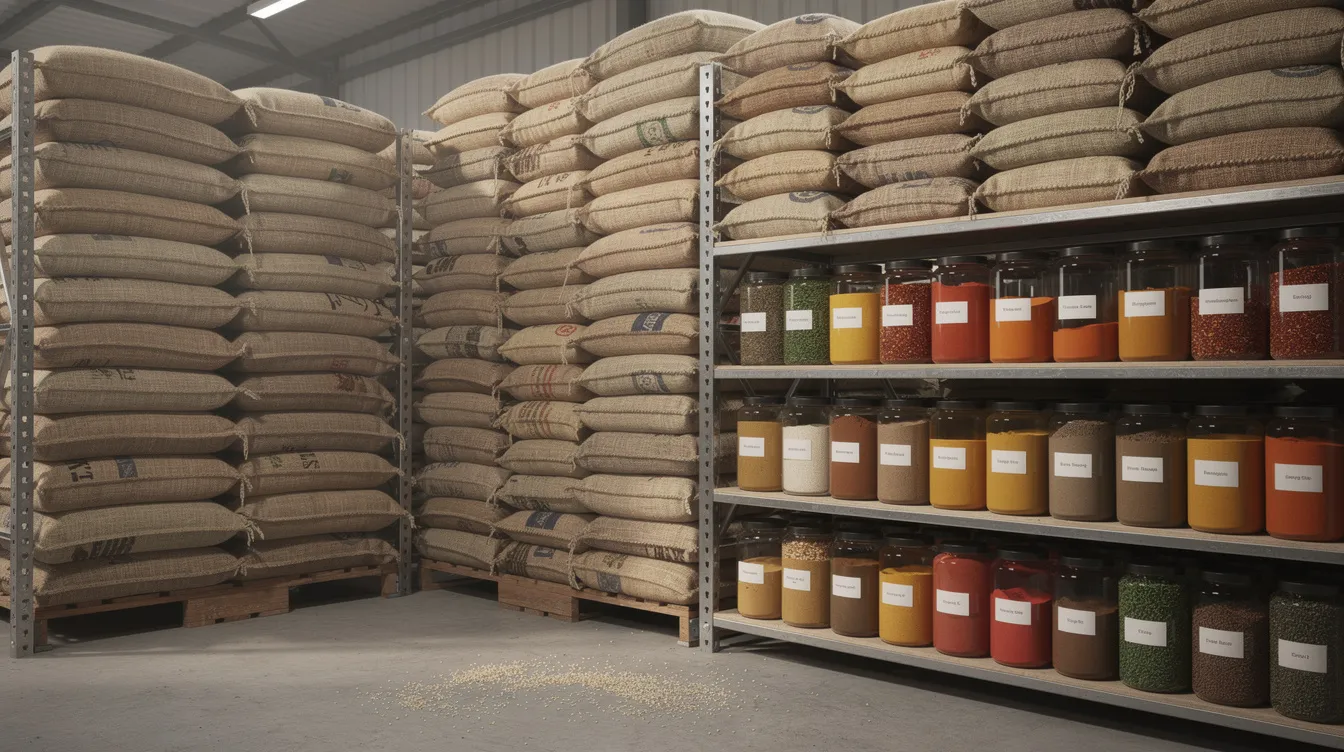
- Flattened rice and core ingredients: 15-30 days of consumption
- Spices, premixes and packaging: 20-45 days
- Finished goods: 10-20 days of cost of production
Receivable periods in the Indian context differ by channel. General trade often works on cash or 0-15 days credit. Modern trade and institutional buyers may stretch to 30-60 days. Supplier credit on ingredients and packaging (15-30 days) partly offsets inventory requirements, reducing net working capital.
The working capital cycle for food-processing plants has lengthened in recent years; average net working capital cycle for food-processing MSMEs reached approximately 77 days in FY24 according to the D&B MSME Sampark Report. Instant poha plant working capital calculation in the DPR should use realistic “days” assumptions, not artificially low numbers chosen to minimise project cost.
Illustrative Working Capital Requirement and Bank Finance
For a plant with monthly cost of goods sold of approximately ₹8 lakh and monthly sales of approximately ₹10 lakh:
| Component | Basis | Illustrative Amount (₹ Lakh) |
|---|---|---|
| Raw Material Inventory | 20 days of consumption | 5.33 |
| Packaging Material | 30 days of consumption | 2.00 |
| Finished Goods | 10 days of cost | 2.67 |
| Receivables | 30 days of sales | 10.00 |
| Cash & Operating Expenses | Minimum buffer | 1.00 |
| Total Current Assets | 21.00 | |
| Less: Creditors (RM + Packaging) | 20 days | 5.33 |
| Net Working Capital Requirement | 15.67 |
From this, promoter margin (typically 20-30% depending on bank policy) is deducted to arrive at eligible bank finance via cash-credit facility. Interest is charged only on the amount utilised, not the full sanctioned limit. Working-capital assessment may be done under turnover method (for limits under ₹1 crore) or operating-cycle method depending on loan size and lender policy. CMA data is mandatory for loans above ₹10 lakh.
Adequate working-capital planning is critical. Without it, the plant cannot maintain uninterrupted production, meet payrolls or service term-loan EMIs.
Project Cost, Means of Finance and Distinction Between Term Loan and Working Capital
“Project cost” includes land development and building (if funded), plant and machinery, electrical installations, utilities, preliminary and pre-operative expenses, margin for working capital and contingencies. Total means of finance must equal total project cost and typically comprise promoter contribution/equity, term loan, unsecured loans (if any) and subsidies.
Poha manufacturing is classified as an agro-processing activity under MSME, opening access to several schemes. PMEGP offers 15-35% capital subsidy for poha manufacturing. Mudra loans provide up to ₹20 lakh without collateral. CGTMSE offers collateral-free loans up to ₹2 crore. PMFME provides a 35% credit-linked capital subsidy for food processing. State food processing schemes offer interest subvention and capital grants. Proper regulatory compliance is necessary for commercial packaged food in India, including FSSAI registration and GST registration.
Term loan normally covers fixed assets (machinery, building, utilities), while working capital is financed by a separate cash-credit/OD limit and margin money. Mixing the two creates repayment and compliance issues. The Instant Poha plant project cost, means of finance and operating cost article details how cost heads are structured at the planning stage.
DSCR, Key Ratios and Bankability of an Instant Poha Project
The simplified DSCR formula:
DSCR = Cash Available for Debt Service / (Interest + Term-Loan Principal Repayment)
Cash available for debt service = Profit After Tax + Depreciation + Interest on Term Loan. Banks require a debt service coverage ratio of 1.25 or above, though exact thresholds vary by lender, scheme and risk profile. In illustrative models for food-processing units, DSCR typically improves from around 1.36 in Year 1 to 2.48 in Year 3 and 3.30 by Year 5 as capacity utilisation stabilises.
Other key ratios for instant poha DPRs:
- Current ratio: banks often require 1.10:1 or above
- Debt equity ratio: typically acceptable up to 3:1
- EBITDA margin, net profit margin, ROCE
- Inventory-turnover days and receivable days
- Interest coverage ratio
Ratios must support each other logically. Very high profit margins combined with very low working capital appear unrealistic and reduce DPR credibility with credit officers.
Sensitivity and Scenario Analysis for Instant Poha Profitability
Sensible instant poha profitability analysis should test downside scenarios:
| Scenario | EBITDA Impact | DSCR Impact |
|---|---|---|
| 5% drop in net realisation | Reduces EBITDA by ~₹6 lakh | May drop DSCR by 0.3-0.5 |
| 10% increase in raw-material cost | Reduces EBITDA by ~₹6.8 lakh | May drop DSCR by 0.4-0.6 |
| Utilisation drops to 60% from 75% | Revenue falls ~20%; fixed costs unchanged | DSCR may approach or fall below 1.25 |
Such sensitivity analysis demonstrates to bankers and investors that the promoter understands risks and has considered downside cases. While preparing financial projections for a DPR, I prefer assumptions that can be explained to the lender rather than projections built simply to produce attractive ratios. Final business decisions on capacity, gearing and working-capital buffers should be based on conservative, stress-tested projections.
Common Financial Projection Mistakes in Instant Poha DPRs
Frequent errors I encounter in instant poha project reports:
- Starting at 100% capacity utilisation in Year 1
- Using MRP as net sales instead of net realisation after trade margins
- Ignoring distributor and retailer margins (which can total 20-30% of MRP)
- Underestimating packaging cost for small consumer SKUs
- Excluding realistic marketing and market research expenses
Working-capital mistakes:
- Assuming all sales are cash sales
- Ignoring inventory build-up for seasonal procurement or new product launches
- Showing unrealistically short debtor days (e.g., 7 days when selling to modern trade)
Accounting errors:
- Treating depreciation as a cash outflow in DSCR calculation
- Omitting tax provision entirely
- Mis-matching balance sheet totals with cash flow
- Leaving term-loan repayment schedules incomplete or inconsistent
“Over-beautified” instant poha financial projections reduce trust with bank appraisers. Realistic, defensible assumptions carry more weight for actual loan sanction than impressive-looking numbers that fall apart under scrutiny.
Role of CMA Data and Bank-Focused Documentation
CMA data (Credit Monitoring Arrangement statements) is the RBI-prescribed format banks use for working-capital assessment. For an instant poha manufacturer seeking both term loan and working capital, CMA data is typically mandatory. Key CMA schedules include existing and projected performance, current assets and liabilities, working-capital gap, proposed bank finance, fund-flow and ratio analysis.
Figures in the CMA data must match those in the DPR’s projected balance sheet and Profit & Loss. Inconsistencies between the two documents raise red flags during bank appraisal. Information required for CMA data includes audited financials (for existing units), projected sales, cost structure, inventory and receivable assumptions.
Project Report Bank offers assistance in preparing and structuring instant poha CMA data and bank-finance projections based on promoter inputs and realistic sector benchmarks. Good-quality CMA data helps banks quickly assess working-capital requirement, MPBF (Maximum Permissible Bank Finance) and repayment capacity.
Illustrative 5-Year Financial Projection Summary
The following table assumes a mid-sized instant poha plant with installed capacity of approximately 225 tonnes/year. All figures are illustrative only.
| Particulars | Year 1 | Year 2 | Year 3 | Year 4 | Year 5 |
|---|---|---|---|---|---|
| Capacity Utilisation (%) | 55% | 70% | 80% | 85% | 90% |
| Net Sales (₹ Lakh) | 84 | 107 | 122 | 130 | 137 |
| EBITDA (₹ Lakh) | 11.8 | 17.1 | 21.3 | 23.4 | 25.6 |
| Profit Before Tax (₹ Lakh) | 4.1 | 9.5 | 14.1 | 16.8 | 19.5 |
| Profit After Tax (₹ Lakh) | 3.1 | 7.1 | 10.6 | 12.6 | 14.6 |
| Cash Accrual (₹ Lakh) | 6.6 | 10.6 | 14.1 | 16.1 | 18.1 |
| Term Loan Outstanding (₹ Lakh) | 16.0 | 12.8 | 9.6 | 6.4 | 3.2 |
| DSCR | 1.38 | 1.88 | 2.51 | 3.05 | 3.60 |
Banks examine trend lines: rising sales, stable or improving margins, reducing leverage and healthy DSCR. These numbers should not be copied into an actual DPR. Professional-quality instant poha project report financial projections must be customised to actual capacity, product mix, machinery list, funding structure and growth opportunities specific to the promoter’s market.
What Makes an Instant Poha Project Financially Viable?
Key conditions for viability: adequate scale, reliable supply of flattened rice and seasonings from Madhya Pradesh or other rice-producing states, efficient machinery with appropriate automation level, controlled wastage, realistic pricing and disciplined receivable management. The process of poha consumption in India continues to grow, with regional demand especially strong in western and central India.
Maintaining a balanced capital structure (reasonable debt-equity), sufficient working-capital lines and conservative selling-price assumptions matters more than projecting high margins. Strong brand positioning, quality consistency and smart packaging choices can gradually improve net realisation and instant poha plant profit margin over time. Entrepreneurs should think in terms of long-term ROCE and cash-flow stability, not just first-year net profit percentage.
In my experience preparing DPRs for poha manufacturing businesses and other food-processing projects, the proposals that get sanctioned are not the ones with the highest projected profit; they are the ones where every assumption can be explained to a branch manager with a straight face.
How Project Report Bank Supports Instant Poha Entrepreneurs
Project Report Bank is a B2B consulting and templates provider specialising in bankable project reports, financial models, CMA data and feasibility reports for Indian MSMEs. For instant poha and ready-to-cook flattened rice products, our services cover:
- Detailed project reports for bank loan applications
- Customised financial projections (5-year Profit & Loss, Balance Sheet, Cash Flow)
- Working-capital assessment and bank-finance structuring
- DSCR and ratio analysis
- CMA data preparation aligned with RBI formats
All projections are prepared on the basis of promoter-provided information, realistic sector benchmarks and applicable banking norms, without any promise of guaranteed finance or returns. Entrepreneurs planning an instant poha business should compile their technical and market assumptions (capacity, product mix, target markets, pricing, costing) so that financial modelling can be done accurately. Proper documentation improves bankability and decision-making.
Conclusion: Evaluating Instant Poha Profitability the Right Way
Instant poha manufacturing profit margin must be evaluated within a complete financial model that integrates capacity, product mix, pricing, cost structure, working capital, project cost and debt profile. A per-kg margin calculation, while useful as a starting point, cannot substitute for multi-year projected Profit & Loss, Balance Sheet, Cash Flow and DSCR analysis. Accounting profit, cash flow, working-capital adequacy and debt-servicing capacity all need to be aligned for a project to be genuinely viable and financeable.
Realistic, defensible instant poha financial projections are far more helpful than optimistic spreadsheets built only to impress lenders. Banks see hundreds of DPRs; the ones they fund are the ones that hold up under questions about market demand, raw-material volatility, distribution costs and cash-flow timing.
Entrepreneurs, investors and consultants evaluating instant poha or related ready-to-eat rice businesses can reach out to Project Report Bank for DPR preparation, financial modelling, CMA data and working-capital planning tailored to Indian MSME conditions.
Author: CA Manish Gugliya FCA, DISA (ICAI) | Practising Chartered Accountant since 2006 Specialising in project finance, DPRs, CMA data and MSME advisory for manufacturing and food-processing projects in India.
Frequently Asked Questions
The following FAQs address common practical doubts about instant poha profitability, working capital and bank-finance documentation that arise in project-planning discussions.
Is instant poha manufacturing business profitable in India?
Instant poha profitability depends on capacity, utilisation, raw-material sourcing, selling price and distribution model. Many units achieve healthy margins when run efficiently with proper working-capital planning. Value-added instant poha (seasoned, cup formats, fortified variants) usually offers better contribution than plain poha; branded retail variants can achieve net margins of 16-22%, and export-grade packaged poha can reach 24-32%. However, higher seasoning, packaging and marketing expenses must be accounted for in the DPR. The business is not automatically profitable; it requires adequate scale, market linkage and disciplined cost control.
How much working capital is typically required for an instant poha plant?
Working capital depends on scale, credit terms and product mix. It typically covers 1-2 months of raw-material and packaging consumption, plus finished-goods stock and receivables, less supplier credit. For a mid-size unit producing 25-30 tonnes per month, the net working-capital requirement can range from ₹8 lakh to ₹16 lakh or more. A proper instant poha plant working-capital calculation in the DPR is essential before approaching banks, as underestimation is one of the most common reasons for operational stress in food-processing MSMEs.
What financial statements do banks expect in an instant poha project report?
Most banks expect 5-year projected Profit & Loss Account, Balance Sheet, Cash Flow Statement, break-even analysis, DSCR calculation and key ratio analysis. For working-capital facilities, CMA data in the RBI-prescribed format is usually mandatory. All figures must be internally consistent, realistic and supported by technical details of capacity, product mix, equipment and cost norms for instant poha manufacturing. Banks will cross-check projected sales against installed capacity and market-research assumptions.
Can an existing flattened rice mill diversify into instant poha products?
Many rice-flakes and poha processing units can add seasoning, mixing and packaging lines to enter the instant poha segment, leveraging existing raw-material handling and flattened rice processing knowledge. This diversification still requires fresh instant poha financial projections, new working-capital planning and possibly additional licences, branding investments and marketing budgets. The equipment required for seasoning and retail packing differs from bulk poha production, so incremental capital expenditure must be factored into the revised business plan.
How do I improve the bankability of my instant poha project?
Keep assumptions conservative. Ensure adequate promoter contribution (typically 20-30% of project cost). Plan realistic working capital based on actual inventory norms and receivable periods. Demonstrate market linkages through letters of intent or existing distributor relationships. Present a well-structured DPR with clear instant poha project financials and CMA data. Engaging a professional such as CA Manish Gugliya or Project Report Bank for DPR and projections helps align the proposal with typical Indian bank appraisal expectations and reduces back-and-forth during credit processing.