

Key Takeaways
- Ice cream plant capacity planning must go beyond the rated capacity of a continuous freezer. It requires integrating market demand, product mix, line balancing, hardening tunnel throughput, cold storage, and financial projections into a single coherent plan.
- Realistic ice cream production capacity per day depends on the bottleneck equipment-often the filling line, hardening tunnel, or cold storage-rather than only mix-processing or freezer capacity.
- Product mix (cups, cones, sticks, bars, tubs, family packs, bulk packs) changes effective capacity, revenue mix, and profitability, and must be modelled explicitly in every industrial ice cream plant DPR.
- Banks and investors closely review installed capacity, effective capacity, capacity-utilisation assumptions, and product-wise revenue projections before approving funding for an ice cream manufacturing plant.
- This article reflects the practical DPR and financial-planning perspective of CA Manish Gugliya, FCA and DISA (ICAI), for industrial ice cream manufacturing projects in India.
Introduction: Why Capacity and Product Mix Define an Ice Cream Project
For an industrial ice cream manufacturing plant, wrong capacity selection can either lock capital into underutilised assets or choke growth during peak summer months when demand surges three to four times above the off-season baseline. The global ice cream market was valued at USD 78.57 billion in 2025 and is expected to reach USD 102.38 billion by 2034, exhibiting a CAGR of 2.95% from 2026 to 2034. Over 12 billion litres of ice cream are consumed annually in the USA and China alone, and there are over 12,700 businesses in the ice cream stores industry in the US. Rising demand globally-including for low fat and dairy-free options-creates real opportunities, but also raises the stakes for getting plant size right.
Ice cream plant capacity planning and ice cream plant product mix are two of the most sensitive assumptions in any industrial ice cream plant DPR or feasibility study. Simply buying a continuous freezer rated at 1,000 litres per hour does not mean the plant can reliably sell 1,000 litres of finished product every production hour throughout the year. The freezer is only one link in a chain that includes mixing, pasteurisation, homogenisation, ageing, filling, hardening, storage, and distribution.
As a practising Chartered Accountant since 2006, my focus-through ProjectReportBank.com-is on how capacity, ice cream production planning, and product mix translate into investment, working capital, profitability, and loan-repayment capacity. This article supports entrepreneurs and companies working with the Industrial Ice Cream Manufacturing Plant Project Report / DPR cluster, complementing more detailed content on manufacturing process, machinery, and project cost.
Meaning of Ice Cream Plant Capacity Planning
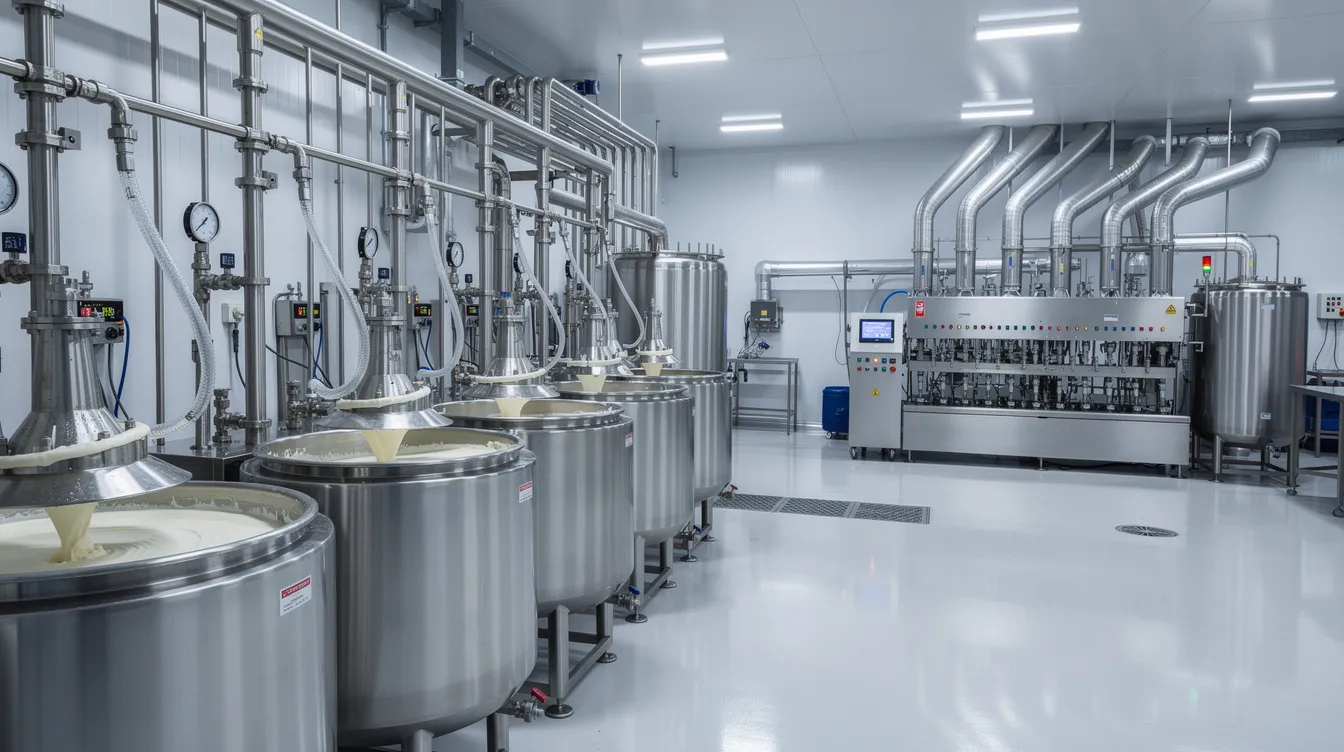
Ice cream plant capacity planning means deciding how much industrial ice cream production capacity to install, in what configuration, and for which products-keeping both market viability and financial feasibility in mind. Proper capacity planning involves aligning expected demand with production capabilities at every stage.
Key terms that a DPR must differentiate clearly:
- Rated or design capacity – The equipment manufacturer’s specification (e.g., a continuous freezer rated at 1,000 LPH of ice cream mix under ideal test conditions). Continuous freezers operate for hours with constant ice cream mix input, unlike batch freezers.
- Installed capacity – The sum of rated capacities of all equipment under idealised continuous operation with zero downtime.
- Effective capacity – Adjusted for real-world factors: equipment availability, line efficiency, CIP and changeover time, and yield losses. Typically 70–90% of installed capacity.
- Production capacity – What the line can actually produce in saleable litres or tonnes during scheduled operating hours.
- Actual capacity utilisation – The ratio of production achieved to effective capacity, as reported in accounts and tracked by lenders.
Saleable output is production after deducting start-up wastage, weight variations, returns, and quality rejections. This is the figure that should flow into revenue projections. A professional DPR should never use these capacity terms interchangeably-lenders and investors will question inconsistencies between installed capacity, effective capacity, and projected sales volume.
Units Used for Measuring Ice Cream Manufacturing Plant Capacity
Industrial ice cream manufacturing capacity is expressed in different units at different stages:
- Mix-processing equipment (blending, pasteurisation, homogenisation) and continuous freezers are rated in litres per hour (LPH) of ice cream mix.
- Filling and packaging lines are rated in cups, cones, sticks, bars, or tubs per hour.
- Annual production is summarised in litres, metric tonnes, or lakh litres per year.
A critical distinction is between ice cream mix volume and finished product volume. Continuous freezers target 80–100% overrun for commercial ice cream through air incorporation. For example, 1,000 litres of mix at 80% overrun yields approximately 1,800 litres of finished ice cream. Batch freezers, by comparison, produce only 10–30 kg of ice cream per hour and are generally suited for gelato-style or artisanal production rather than industrial scale.
During continuous freezing, the process operates at approximately -5°C to -7°C. DPRs should clearly state whether “ice cream plant capacity in LPD” refers to mix LPD, finished ice cream LPD, or saleable litres after losses. The most appropriate unit may differ between the processing section (LPH), filling line (packs/hour), hardening tunnel (tonnes/day), and cold storage (tonnes or pallet positions).
How to Calculate Ice Cream Manufacturing Plant Capacity
Capacity planning should take into account the slowest step in the production process as the bottleneck. Planning must also include sufficient room for storage, packaging, and quality control checks. Here are the core formulas:
- Installed annual capacity = Bottleneck rated throughput × Scheduled production hours per day × Operating days per year
- Effective annual capacity = Installed annual capacity × Equipment availability × Line efficiency × Finished-product yield
- Projected annual production = Effective annual capacity × Planned capacity utilisation
Where:
- Equipment availability = percentage of scheduled time the machinery is mechanically available (excluding breakdowns, planned maintenance)
- Line efficiency = losses from speed variations, minor stoppages, flavour changeovers
- Yield = losses from start-up waste, overfill, quality rejections
- Capacity utilisation = percentage of effective capacity the DPR assumes will be used (e.g., 50–65% in Year 1, rising as the market develops)
Warning: Do not double-count. If availability already deducts maintenance and changeover time, do not deduct the same factor again inside utilisation. Banks check this in detail.
Illustrative Calculation (Illustrative Only – Not an Industry Benchmark)
| Parameter | Assumption |
|---|---|
| Continuous freezer rated capacity | 1,000 LPH (mix) |
| Overrun | 80% → ~1,800 LPH finished product |
| Shifts per day | 2 × 8 hours = 16 hours |
| Operating days per year | 280 |
| Equipment availability | 90% |
| Line efficiency | 85% |
| Finished-product yield | 97% |
| Planned capacity utilisation (Year 1) | 60% |
Step-by-step:
- Installed annual capacity = 1,800 LPH × 16 hrs × 280 days = 80,64,000 litres
- Effective annual capacity = 80,64,000 × 0.90 × 0.85 × 0.97 = 59,84,122 litres (approx.)
- Projected Year-1 saleable output = 59,84,122 × 0.60 = 35,90,473 litres (approx.)
These figures are illustrative. Actual output depends on the specific filling lines, hardening tunnel, cold storage, and product mix in your project.
Difference Between Processing Capacity and Finished-Product Capacity
The rated capacities of mix preparation, pasteuriser, or continuous freezer do not automatically equal the volume of saleable ice cream that can be packed, hardened, stored, and dispatched. Equipment throughput across the entire line is governed by pasteurisers, homogenisers, and packaging lines working in coordination.
The main steps of the industrial ice cream manufacturing process and production line include:
- Mix preparation (combining milk, cream, sugar, stabilisers, emulsifiers)
- Pasteurisation and homogenisation (ice cream manufacturing requires pasteurisers and homogenisers for food safety; homogenisation also breaks down fat globules for smoother texture)
- Ageing tanks (the mixture is aged for 4 to 24 hours before freezing, and aging tanks may become a bottleneck due to the requirement of chilling the mix before freezing)
- Continuous freezing and air incorporation
- Ingredient and inclusion feeding (fruit, chocolate, nuts)
- Filling or extrusion into cups, cones, sticks, bars, tubs
- Wrapping, cartoning, secondary packaging
- Hardening at -30°C to -40°C
- Frozen storage and dispatch
Processing capacity may exceed filling capacity if cup or cone fillers run slower than the freezer. Similarly, hardening tunnel or frozen storage may become the real limiting factor during peak-season production. In ice cream plant capacity calculation, the sustainable bottleneck capacity across all interconnected stages becomes the true industrial ice cream production capacity for DPR and financial modelling purposes.
Production-Line Balancing for an Industrial Ice Cream Manufacturing Plant
Line balancing means matching capacities of different equipment so that no major station is chronically idle or overloaded. This is central to ice cream production line capacity planning.
Sections whose capacities must be coordinated:
- Mix-processing area and ageing tanks
- Continuous ice cream freezers
- Cup and cone filling lines
- Stick and bar extrusion or moulding lines
- Family-pack and tub fillers, ice cream sandwich production line
- Secondary packing and cartoning
- Hardening tunnels
- Cold-storage rooms and dispatch area
CIP (clean-in-place) systems must be sized to prevent them from being a production bottleneck. Production scheduling must account for sanitation and changeover times to optimise efficiency. Detailed machinery sizing and configuration is summarised in a separate article on automatic ice cream plant machinery and equipment cost.
Poor line balancing creates real problems. For example, if a freezer outputs 1,800 LPH of finished ice cream but the hardening tunnel can only handle 1,200 LPH, the excess either backs up in packaging or must be diverted-wasting capacity, creating quality issues from partial hardening, and adding overtime cost.
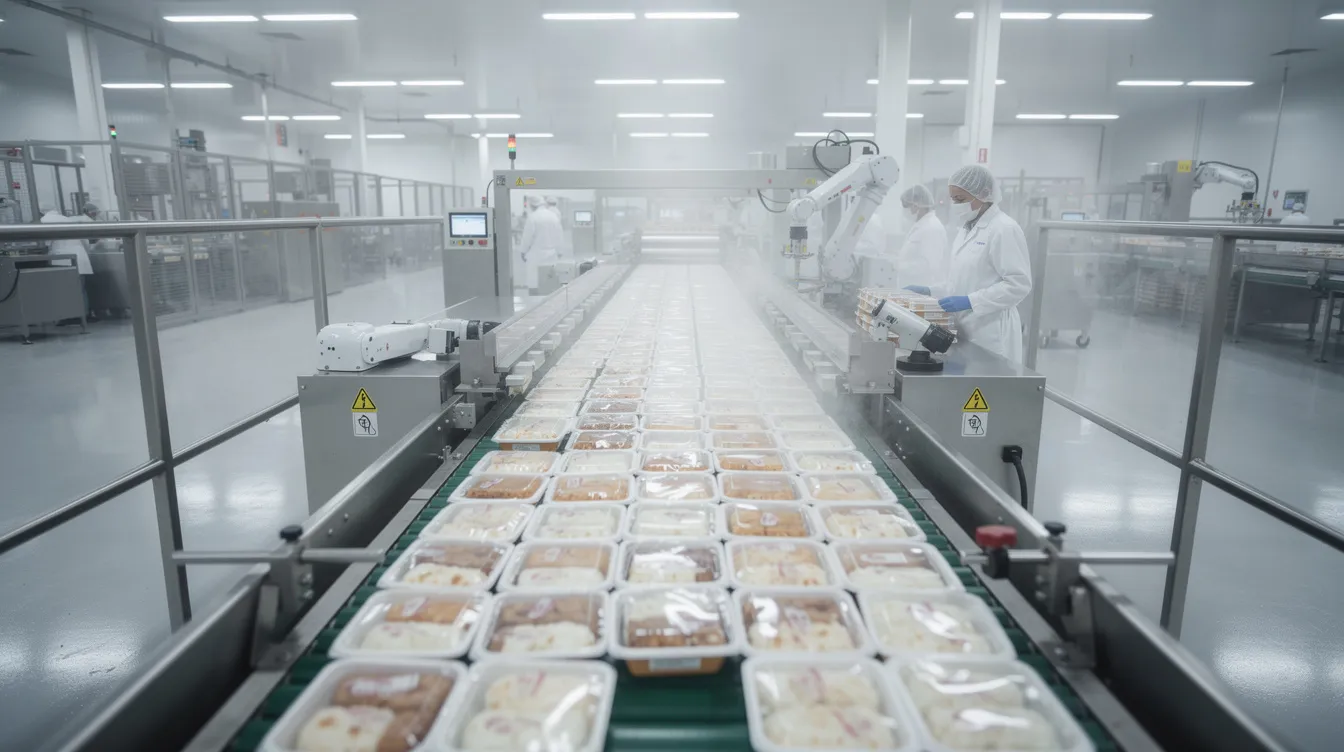
Factors Affecting Capacity Selection and Installed Capacity of an Ice Cream Plant
Ice cream manufacturing plant capacity should be supported by a structured market assessment and financial feasibility study, not merely promoter optimism or machinery catalogue figures. Market demand fluctuations are critical in planning production capacity for ice cream.
Demand-side factors:
- Present market demand in target districts or states, and expected growth over 5–7 years
- Geographical reach and cold-chain coverage
- Planned dealer and distributor network
- Balance between institutional (hotels, QSR, catering) and retail demand
- Realistic sales build-up during the initial stabilisation period
Operational and technical factors:
- Number of shifts (1–3); seasonal hiring is important to meet peak production demands
- Product changeover time and cleaning requirements
- Regulatory standards affect downtime due to cleaning and inspection processes; facilities must comply with local food safety laws and standards
- Cooling requirements for ice cream production are significant and need careful planning
- Properly sized refrigeration systems are crucial for maintaining product quality and meeting demand
- Stable access to raw materials is necessary for uninterrupted production runs
- Packaging-material availability and lead times
Financial and strategic factors:
- Project cost impact-more capacity means higher initial capex on building, machinery, and utilities
- Working-capital availability for raw materials, packaging, finished-goods inventory, and receivables
- Scope for modular expansion by adding freezers, fillers, or cold rooms when volumes grow
Capacity choices must be consistent with the industrial ice cream plant setup cost in India and the promoter’s financing plan.
Seasonality and Peak-Demand Planning for Ice Cream Manufacturing
Ice cream sales peak during the summer months and drop in winter. In India, demand in March–June is often several times the monsoon and winter baseline, though exact ratios vary by region and market segment. Demand forecasting aids in analysing historical sales data and market trends to determine the right capacity configuration.
Key considerations:
- Hotter regions with longer summers, tourist destinations, and institutional supply to QSRs or cinemas may offer more stable consumption patterns
- Festival and marriage seasons can drive bulk ice cream manufacturing demand
- Designing installed capacity purely for peak-summer demand leads to underutilisation and high fixed costs off-season
- Designing only for average demand may leave capacity short during peak weeks, causing lost sales
Planning levers:
- Building frozen inventory ahead of peak season (within shelf stability limits); cold storage capacity must accommodate both peak production and safety stock volumes
- Increasing shifts temporarily in peak months; capacity must balance peak seasonal demand with off-season efficiency
- Scheduling maintenance and development activities in off-season
- Cold chain storage requires matching freezing line output with storage capacity
- Shelf life and quality depend on maintaining low temperatures and preventing heat shock during storage and distribution
Working capital pressure rises when the plant builds inventory before peak-season sales, so DPRs must align seasonal production planning with cash-flow projections. For deeper coverage of hardening and refrigeration constraints, see ice cream cold storage, refrigeration and hardening tunnel requirements.
Meaning of Product Mix in an Industrial Ice Cream Plant
In an industrial ice cream manufacturing plant, product mix means the planned combination and proportion of different product categories, pack sizes, flavors, price points, and customer segments. Ice cream plant product mix decisions include how much volume will go into cups, cones, sticks and bars, ice cream sandwiches, family packs, tubs, and bulk institutional packs-and how much will be dairy ice cream versus value-added frozen dessert products where permitted.
Product mix directly affects:
- Machinery selection (cup and cone lines vs. stick-bar extrusion lines)
- Packaging-line speed and labour requirement
- Cleaning and changeover time-and therefore effective ice cream production line capacity planning
- Material cost structure (inclusions, premium ingredients, formulation complexity)
- Selling price, contribution margin, and working capital across SKUs
A realistic product mix is essential for product-wise revenue projections, ice cream plant sales mix, and product mix profitability analysis in the DPR. Lenders scrutinise whether the proposed mix matches the target market and distribution strategy.
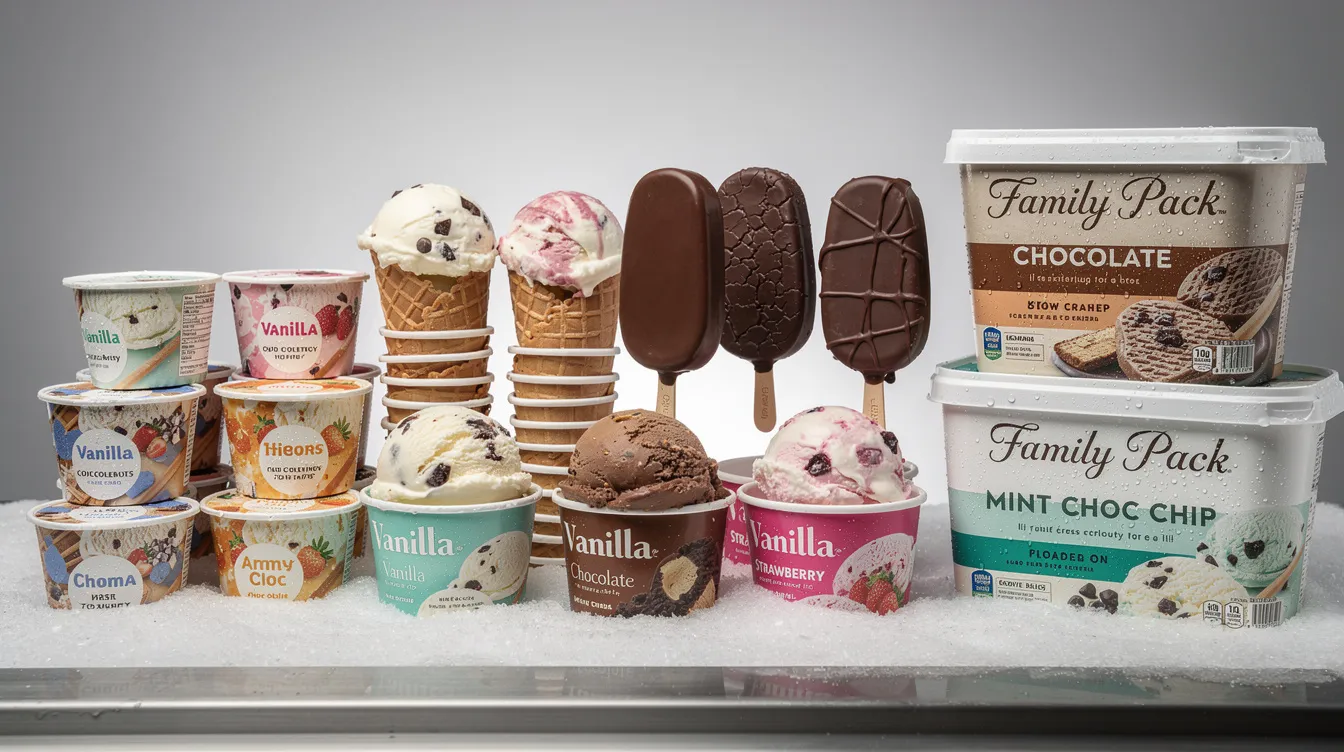
Major Product Categories in an Industrial Ice Cream Product Mix
Industrial ice cream manufacturers typically plan their portfolio around several major product groups, each with different line speeds, margins, and storage implications. Note that under Indian food standards, ice cream must contain at least 10% milkfat by weight; products using vegetable fat are classified as frozen desserts and must be labelled accordingly under current FSSAI regulations. Demand for low fat and dairy-free variants is also increasing, driving product innovation.
- Cups – High-volume, entry-price SKUs (60–100 ml) for mass retail, school canteens, and start up businesses entering the market. High filling speed, moderate packaging intensity.
- Cones – Impulse products with higher packaging complexity; a dedicated ice cream cone production line may be needed.
- Sticks and bars – Require stick and bar production or extrusion lines; popular in impulse and kiosk channels. Chocolate-coated or fruit-layered variants add a layer of process complexity.
- Ice cream sandwiches – Novelty SKUs requiring more complex packaging and handling.
- Family packs and tubs – Ice cream tub manufacturing (500 ml, 1 litre, 2 litre) is important for home consumption and modern retail, with lower pack counts but higher selling price per unit.
- Bulk/institutional packs – 4–5 litre tubs for hotels, restaurants, caterers. Lower pack count, high volume per unit. Can also serve export markets where logistics permit.
- Premium and value-added – Loaded inclusions, ripples, premium ice cream product mix with higher recipe cost, lower overrun, and potentially lower line speed.
Legal classification between ice cream and frozen dessert depends on applicable Indian food standards and should be verified from current FSSAI requirements. DPRs should describe both categories separately where relevant.
Product-Mix Planning Table (Qualitative Guidance)
The following table provides qualitative orientation for capacity and product-mix planning. Actual performance depends on selected machinery, automation level, and supplier specifications.
| Product Category | Typical Pack Format | Target Market | Relative Line Speed | Packaging Intensity | Changeover Requirement | Storage Impact | Revenue Potential |
|---|---|---|---|---|---|---|---|
| Cups | 60–100 ml | Mass retail, impulse | High | Medium | Low | Low per unit | Moderate |
| Cones | 90–120 ml | Impulse, kiosks | Medium | High | Medium | Medium | Moderate |
| Sticks & bars | 60–80 ml | Impulse, retail | Medium | High | Medium–High | Medium | High |
| Family packs | 500 ml–2 L | Home, modern trade | Low–Medium | Medium | Medium | High per unit | High |
| Tubs | 500 ml–1 L | Retail, gifting | Low–Medium | Medium | Medium | High per unit | High |
| Ice cream sandwiches | 80–100 ml | Novelty, impulse | Low | High | High | Medium | Medium–High |
| Bulk/institutional | 4–5 L | HoReCa, catering | Low (packs) | Low | Low | Very high per unit | Moderate |
| Premium SKUs | Various | Premium retail | Low | Very high | High | Medium | Very high |
| Frozen dessert products | Various | Value segment | Medium–High | Medium | Medium | Medium | Moderate |
This table is for planning orientation, not for quoting figures to banks.
Volume Mix Versus Revenue Mix
A product’s share in total production volume may be very different from its share in total revenue. For example, low-priced cups may form 40% of volume but only 25% of revenue, while premium tubs may be 10% of volume but 20% of revenue.
In a DPR, it is important to show both volume mix (in litres or units) and revenue mix (₹) across product categories, because lenders and investors want to see how the ice cream plant sales mix supports profitability and break-even capacity.
Illustrative Volume Mix vs Revenue Mix (Illustrative Only)
| Product Category | Share of Volume (%) | Avg. Selling Price (₹/litre, indicative) | Share of Revenue (%) | Packaging-Cost Intensity | Contribution Potential |
|---|---|---|---|---|---|
| Cups | 40 | 120 | 28 | Medium | Medium |
| Cones | 15 | 150 | 13 | High | Medium |
| Sticks & bars | 15 | 200 | 18 | High | High |
| Family packs & tubs | 20 | 180 | 21 | Medium | High |
| Bulk/institutional | 5 | 100 | 3 | Low | Low–Medium |
| Premium novelties | 5 | 300 | 17 | Very high | High |
| Total | 100 | – | 100 | – | – |
These figures are illustrative. Actual numbers must be project-specific and based on a proper ice cream plant feasibility study. No guaranteed margins are implied.
How Product Mix Changes Effective Plant Capacity
Even with the same installed capacity of ice cream plant, the daily saleable output can vary significantly depending on whether the plant mainly runs small cups, sticks, or larger family packs and tubs. Product mix complexity can lead to increased downtime for cleaning and setup between runs.
- Different filling speeds: a cup line may fill at 6,000–10,000 cups/hour, while a tub filler may manage 800–1,500 tubs/hour
- Stick and bar moulding lines have their own cycle times and dwell requirements
- Inclusion and ripple addition slows throughput
- More flavors and formats mean more frequent changeovers and allergen-control procedures
- Smaller packs and more SKUs increase changeover and cleaning time, reducing effective hours at rated speed
- Hardening time differs: small sticks may harden in 20 minutes, while 2-litre tubs may need 60–90 minutes
- Wrapping and cartoning speeds vary by format
Product-mix-adjusted capacity is more useful than nominal machinery capacity for DPR preparation. Realistic ice cream plant capacity utilisation assumptions must be based on the planned product mix, not on a single high-speed SKU alone.
SKU Planning and Operational Complexity
Promoters planning a new industrial ice cream manufacturing plant often propose too many flavors and pack-size variations at launch. While this looks attractive on paper, it can severely reduce line efficiency and ice cream production capacity per day.
Key operational considerations:
- Minimum economic batch size for each product-running too-small batches increases waste and reduces efficient production
- Slow-moving SKUs occupy valuable frozen storage and tie up working capital
- Each additional SKU adds changeover time (wash-down, flavour change, allergen control) and start-up losses
- Forecasting difficulty and packaging-material inventory multiply with more SKUs
Recommended approach: Start with a limited but commercially strong set of SKUs where distributors see demand. Monitor sales and production performance, then gradually introduce additional pack sizes or novelties based on data-a phased portfolio strategy rather than launching everything at once. Rationalisation of low-performing SKUs over time can improve consistency and free up capacity without additional capex.
Illustrative Capacity and Product-Mix Model for an Industrial Ice Cream Plant
All figures below are illustrative only-not industry-standard benchmarks. Replace with project-specific data.
Assumed technical base:
- One 1,000 LPH continuous freezer (mix basis), ~1,800 LPH finished product at 80% overrun
- Sufficient mix-processing and ageing capacity
- 2 filling lines: one for cups/cones, one for family packs/tubs
- Adequate hardening tunnel and cold storage
- 2 shifts (16 hours/day), 280 operating days/year
Effective capacity summary:
- Installed daily capacity: 1,800 × 16 = 28,800 litres/day (finished product)
- Effective daily capacity (after 90% availability × 85% efficiency × 97% yield): ~21,380 litres/day
- Effective annual capacity: 21,380 × 280 = ~59,86,400 litres/year
Illustrative product-wise allocation:
| Category | Volume Share (%) | Annual Volume (litres) | Typical Pack Size | Approx. Annual Saleable Units | Avg. Price (₹/L) | Revenue Share (%) |
|---|---|---|---|---|---|---|
| Cups | 40 | 23,94,560 | 80 ml | ~2,99,32,000 | 120 | 28 |
| Cones | 15 | 8,97,960 | 100 ml | ~89,79,600 | 150 | 13 |
| Sticks & bars | 15 | 8,97,960 | 70 ml | ~1,28,28,000 | 200 | 18 |
| Family packs & tubs | 20 | 11,97,280 | 1,000 ml | ~11,97,280 | 180 | 21 |
| Bulk/institutional | 5 | 2,99,320 | 5,000 ml | ~59,864 | 100 | 3 |
| Premium novelties | 5 | 2,99,320 | 100 ml | ~29,93,200 | 300 | 17 |
| Total | 100 | 59,86,400 | – | – | – | 100 |
During peak season, the plant might push to more shifts and prioritise high-speed cup and stick lines for higher utilisation. Off-season operations may rely more on family packs and institutional packs to maintain reasonable annual utilisation and manage storage.
Capacity-Utilisation Assumptions in an Industrial Ice Cream Plant DPR
Banks and investors generally expect capacity utilisation to ramp up gradually-not to be at 90–100% in the first year of commercial production.
Reasons for progressive ramp-up:
- Time needed to appoint and stabilise distributors
- Product trials and consumer acceptance in the market
- Refining ice cream production planning, quality, and consistency
- Resolving initial machinery and utility teething issues
- Navigating at least one full seasonal cycle
Many DPRs assume a gradual increase-perhaps 50–65% in Year 1, rising to 85–90% over 4–6 years-but there is no universal percentage. Assumptions must be justified with the marketing and distribution plan.
Capacity utilisation assumptions must be consistent across technical, production, and financial sections. Installed capacity, effective capacity, projected annual production, and sales volume should mathematically align. Promoters should include sensitivity analysis showing the impact of lower utilisation on profitability, DSCR, and break-even capacity.
Effect of Capacity and Product Mix on Project Cost
Higher ice cream manufacturing plant capacity and a more complex product portfolio directly increase project cost and infrastructure requirements. Ice cream plant setup costs include machinery and land expenses, and capital investments can vary significantly by capacity.
Major cost areas influenced by capacity:
- Processing equipment size and number (pasteurisers, homogenisers, ageing tanks)
- Continuous ice cream freezer capacity and number
- Number and type of filling and packaging lines
- Hardening tunnel capacity and refrigeration system size
- Frozen cold-storage capacity
- Building area, power connection, transformer capacity, utility lines
- Material-handling systems, quality-control infrastructure
Complex product mixes (premium sticks with coatings, multiple inclusions, high SKU count) require additional specialised equipment and higher packaging machinery cost. For a detailed discussion of capital structure, readers can refer to ice cream plant project cost and means of finance.
Effect of Capacity and Product Mix on Revenue and Profitability
Installed capacity alone does not generate revenue. Revenue depends on actual production, saleable output, and realised prices across the chosen product mix. Operating costs are primarily driven by raw materials, especially milk and cream.
- Product mix affects average selling price, packaging cost per litre, and material consumption per litre
- Dealer and distributor margins, promotional expenses, and credit terms differ across product categories and channels
- Higher-priced products are not automatically more profitable if they require expensive ingredients, slower production speeds, or more complex packaging
- Gross profit margins for ice cream manufacturing typically range from 40–50%, but actual results depend heavily on scale, product mix, and operational efficiency
- Break-even for ice cream manufacturing businesses typically ranges from 3 to 5 years
- Ice cream plant break-even capacity depends on fixed costs and average contribution margin from the selected product mix
Capacity Expansion Strategy for an Industrial Ice Cream Manufacturing Plant
Capacity planning should consider not only the initial configuration but also how the plant can be expanded economically if growth exceeds the first-stage industrial ice cream production capacity. Modular production designs allow for scaling as needed based on business growth. Future expansion considerations should be incorporated into initial plant design.
Typical modular expansion options:
- Additional ageing tanks to support more variety or longer shifts
- Installing an additional continuous freezer
- Adding a parallel cup/cone filling line or stick/bar extrusion line
- Expanding hardening tunnel and cold-storage area
- Scaling up refrigeration systems with spare chiller capacity or space for extra compressors
Expansion strategy must be reflected in the financial model-additional capex phases, funding plan, and expected increase in capacity utilisation and revenue. Expanding shifts (from 1 to 2 to 3) is often the first step before adding major machinery, but labour, maintenance, and quality control capacity must also scale accordingly.
Capacity Planning for a Bankable Ice Cream Plant DPR
Lenders and institutional investors examine capacity assumptions closely because they drive revenue, profitability, and loan-servicing ability in an ice cream manufacturing project report.
Banks typically review:
- Clarity of installed and effective capacity in LPD or LPH
- Basis of market-demand estimates and demand forecasting methodology
- Product-wise ice cream plant production projections and capacity-utilisation path
- Bottleneck analysis across process stages
- Seasonal capacity planning and inventory assumptions
- Working-capital requirement and whether break-even capacity and DSCR remain comfortable under lower-than-planned utilisation
DPRs should enclose realistic machinery quotations, layout drawings, and utility load estimates. A bankable industrial ice cream plant DPR should present one internally consistent story across technical capacity, product-wise sales volume, revenue, cost structure, working capital, and funding.
Common Capacity-Planning Mistakes in Industrial Ice Cream Projects
Many DPRs for ice cream manufacturing plants fail not because the market is weak, but because capacity and product-mix assumptions are unrealistic or internally inconsistent.
Technical mistakes:
- Selecting capacity only by looking at freezer catalogues
- Ignoring bottlenecks in filling and packaging
- Underestimating hardening tunnel and cold-storage limitations
- Confusing mix volume with finished-product volume
- Not accounting for production losses and weight variations
Product-mix errors:
- Proposing too many SKUs at launch
- Mismatching product mix with installed packaging machinery
- Ignoring cleaning and changeover time
- Ignoring the effect of product mix complexity on effective capacity
Financial-modelling mistakes:
- Assuming near-full capacity from the first year
- Using peak-summer demand as if it represents the entire year
- Using one set of capacity figures in technical sections and different numbers in financial projections
- Omitting realistic working-capital need to support inventory at higher capacities
- No clear path for future expansion
Correcting these issues early-during DPR preparation-can prevent difficult conversations with lenders and improves the credibility of the project proposal.
Practical Capacity-Planning Checklist for Ice Cream Manufacturing Plants
Promoters and consultants can use this checklist while finalising ice cream plant capacity and product-mix assumptions:
- [ ] Defined target market and geographical coverage
- [ ] Clear choice of capacity unit (LPH, LPD, tonnes per annum, packs/hour)
- [ ] Selected product categories and pack sizes
- [ ] Documented product-wise volume mix
- [ ] Rated capacity of each key machine and line
- [ ] Effective capacity calculated with availability, efficiency, yield adjustments
- [ ] Bottleneck equipment identified
- [ ] Number of shifts and scheduled production hours confirmed
- [ ] Operating days per year (typically ~280–300)
- [ ] Seasonal demand assumptions documented
- [ ] Realistic capacity-utilisation trajectory over projection period
- [ ] Hardening-tunnel and cold-storage capacity adequacy confirmed
- [ ] Utilities (power, water, refrigeration, compressed air) sufficient for designed capacity
- [ ] Working-capital requirement aligned with capacity and seasonality
- [ ] Project cost impact of capacity decisions quantified
- [ ] Provision for future expansion in layout and utilities
- [ ] Basic sensitivity checks for lower demand or slower ramp-up completed
Use this checklist as an internal review tool before sharing the industrial ice cream plant DPR with banks, investors, or partners.
Professional Conclusion
Effective ice cream plant capacity planning and thoughtful product-mix design are central to making an industrial ice cream manufacturing plant technically robust, market-aligned, and financially viable. Every decision-from the number of continuous freezers to the mix of cups, cones, and family packs-has a direct bearing on project cost, revenue, working capital, and loan-repayment schedules.
Investors and lenders look for coherence among ice cream production line capacity planning, seasonal demand patterns, SKU portfolio, utilities, refrigeration, packaging, storage, working capital, and financial projections. A DPR that tells one consistent, well-supported story across all these dimensions is far more likely to be developed into a funded, operational project.
From my professional perspective as CA Manish Gugliya, the role of a Chartered Accountant is to assist promoters in translating technical capacity and product-mix plans into realistic financial projections, CMA Data, feasibility analysis, and bank-finance documentation-without certifying future results. If you are an entrepreneur, dairy company, or project promoter planning an industrial ice cream project, I invite you to approach ProjectReportBank.com for project-specific DPR preparation, capacity and product-mix modelling, and related financial-planning support.
Frequently Asked Questions (FAQ)
How is ice cream plant production capacity calculated in practice?
Capacity is usually calculated from the slowest (bottleneck) stage-often the filling line, hardening tunnel, or cold storage-using rated throughput × effective production hours × operating days, then adjusting for equipment availability, line efficiency, yield, and planned utilisation. Professional DPRs should show these calculations step-by-step so that investors and bankers can clearly see how annual saleable output has been derived from equipment specifications.
What is the difference between installed and effective capacity in an ice cream manufacturing plant?
Installed capacity is what the line could theoretically produce at rated speed for all scheduled hours with no stoppages. Effective capacity is after deducting realistic downtime for maintenance, CIP cleaning, product changeovers, minor stops, and normal yield losses. Financial and production projections should always be based on effective capacity, not merely on installed capacity printed in machinery brochures.
Which unit is best for measuring industrial ice cream capacity for a DPR?
For processing and freezer selection, capacity in litres per hour or litres per day is generally used. For packaging lines, packs per hour by format is more meaningful. Annual capacity is often summarised in tonnes or lakh litres per year. DPRs should clearly state whether figures refer to mix volume, finished-product volume, or saleable output, so that production, sales, and financial tables remain consistent.
Can the same line manufacture cups, cones, and family packs?
Some filling machines are modular and can handle more than one format (e.g., cups and small tubs), but cones often need specialised handling, and family packs may require different fillers. Frequent format changes also reduce effective capacity due to changeover and cleaning time. Promoters should discuss format flexibility, changeover time, and long-term product-mix plans with equipment suppliers before locking the machinery configuration in the DPR.
How does product mix affect working capital and project cost?
A wider product mix with many SKUs increases investment in packaging materials, frozen finished-goods inventory, and sometimes specialised inclusions, which raises working-capital needs even at the same output volume. Certain formats-such as sticks, bars, or high-end novelties-may require additional specialised machinery and hardening capacity, increasing initial project cost compared to a simpler cups-and-family-packs-focused plant.