Key Takeaways
- A resort revenue model in India is built on multiple streams – rooms, food and beverage, banquets and weddings, recreation, spa and other ancillary services – not just room rent.
- Realistic assumptions for occupancy, ARR/ADR, RevPAR, food revenue and banquet income are the backbone of a bankable Resort Project Report and DPR.
- Resort room revenue is calculated as: Number of Rooms × Available Room Nights × Occupancy × ARR. Banks scrutinise every variable in this formula during loan appraisal.
- Seasonality, guest mix and property positioning (leisure, MICE, destination wedding, wellness) strongly influence resort revenue streams and year-wise projections.
- Conservative, well-researched and internally consistent revenue projections strengthen discussions with lenders and investors – not the highest projected turnover.
Explore Resort Project Report / DPR Guides
Explore our Resort Project Report and DPR guides covering setup cost, equipment, project cost, revenue, financial projections, occupancy, feasibility and bank finance.
Introduction: Why Resort Revenue Model Matters in a DPR
When promoters approach me for a resort project report, the conversation often starts with land, architecture and interior design. However, long-term viability depends on a diversified resort’s revenue strategy – not just the number of rooms or construction quality.
This article is written from my perspective as a practising Chartered Accountant who prepares DPRs, CMA data and financial projections for bank loans. The focus is squarely on the resort revenue model: how to structure, calculate and project income heads realistically for a bankable financial model. We will cover resort room revenue, resort food and beverage revenue, resort banquet revenue, destination wedding revenue, event and MICE income, recreation, spa and wellness, and other income. Project cost, setup cost and means of finance are covered separately on ProjectReportBank.com.

Understanding the Resort Revenue Model
A resort revenue model translates physical capacity into projected income. The conceptual flow is straightforward: capacity (available room nights, restaurant seats, banquet hall size) leads to utilisation (occupancy, covers served, events hosted), which combines with guest spending (ARR, average check, event billing) to produce department-wise revenue.
It is critical to distinguish between revenue capacity – the theoretical maximum if every room, seat and treatment slot is fully utilised at rack rate – and the realistic expected revenue that accounts for seasonality, demand fluctuations and competitive pressures. Effective revenue management considers pricing, occupancy, and inventory to maximize returns, but no lender expects 100% utilisation. Resorts utilize a diversified mix of revenue streams to maximize profitability. Total revenue per available room (TRevPAR) measures overall resort earnings including non-room services, making it a useful supplementary metric.
Total Resort Revenue = Room Revenue + F&B Revenue + Banquet/Event Revenue + Recreation & Spa Revenue + Other Income
The share of each stream varies between a hill leisure resort, a destination wedding resort, a corporate MICE property and a wellness retreat.
Major Revenue Streams of a Resort
Indian resort properties typically earn from six key components. Resorts create tiered offerings from basic rooms to luxury villas, while guest segments influence revenue potential through varied spending habits. Ancillary services like dining and spa treatments are major profit pillars besides room rates.
| Revenue Stream | Typical Revenue Driver | Key Assumption |
|---|---|---|
| Rooms | Available room nights | Occupancy × ARR |
| Restaurant / F&B | Resident + outside guests | Covers × average spend |
| Banquets / Events | Weddings, MICE functions | Events × average billing |
| Recreation | Guest participation | Users × activity charges |
| Spa / Wellness | Treatment demand | Customers × average ticket |
| Other Income | Activity-specific services | Relevant utilisation rates |
It is wrong to assume standard percentage splits without studying the specific concept. All-inclusive properties charge a flat fee for services, while a la carte models allow higher per-transaction spending. EP, CP and MAP packages shift revenue between rooms and food and beverage, and the financial model must handle this carefully.
Resort Room Revenue Model
Room revenue is typically the largest contributor. The formulas are simple but the assumptions behind them require careful thought.
- Available Room Nights = Number of Rooms × Operating Days
- Occupied Room Nights = Available Room Nights × Occupancy Rate
- Room Revenue = Occupied Room Nights × Average Room Rate (ARR)
Accommodation revenue is driven by nightly room rates and varies based on demand. Dynamic pricing algorithms optimize revenue per available unit during peak seasons and across accommodation tiers.
Illustrative Example (not a benchmark): Consider a 60-room resort in Rajasthan operating 360 days. Year-1 average occupancy is 45%, realised ARR is ₹8,000, and about 5% of occupied rooms are complimentary.
- Available room nights = 60 × 360 = 21,600
- Occupied room nights = 21,600 × 0.45 = 9,720
- Paid occupied rooms ≈ 9,234 (after complimentary deduction)
- Room revenue ≈ ₹7.39 crore
Seasonal pricing matters: ARR during Diwali, Christmas or long weekends may be ₹12,000, dropping to ₹6,000 in monsoon months. OTA commissions (15–25%) and corporate contracted room rates reduce the realised ARR well below rack rate. Room bookings through direct channels offer greater control over pricing.
Occupancy Rate Assumptions for Resort Revenue Projection
Occupancy is the single most sensitive assumption in a resort revenue projection. Resorts face occupancy swings of up to 45% between peak and off-season months. Seasonality impacts occupancy caps and requires flexible pricing models.
Opening-year occupancy for a new resort typically ranges from 35–50%. Stabilised occupancy – achieved by Year 3 or 4 – might reach 60–75% depending on location and positioning. Beach destinations had 74% occupancy rates through October 2024, while winter occupancy improved to 68% with dynamic pricing adjustments.
Banks become cautious when Year-1 occupancy is projected at 70–80% without supporting rationale. Promoters should analyse competitor resorts, tourism department data, OTA listing occupancy, tour operators and local travel agents to build evidence-based assumptions. A month-wise breakdown by weekday, weekend, holiday and shoulder seasons is far more credible than a single average figure.
ARR / ADR and Room Pricing Assumptions
Average Room Rate and Average Daily Rate are generally used interchangeably in resort financial models. Factors influencing ARR include resort category, destination popularity, room type, amenities, brand positioning and distribution channel. Luxury resorts can command premium pricing with exclusive suites and perks.
A published tariff of ₹8,000 might translate into a realised ARR of only ₹6,200 after discounts, OTA commissions and promotional offers. Resorts experienced rate volatility of up to 45% in 2024-2025. Many resorts rely on third-party channels for bookings, limiting pricing control, and legacy systems hinder real-time pricing decisions in many resorts. AI can help detect micro-trends in guest booking behavior, predict demand shifts and optimize rates in real-time. Resorts using AI report RevPAR lifts of up to 35%.
Package inclusions (MAP, activity bundles) shift revenue between rooms and food revenue. Promoters should build ARR assumptions bottom-up using competitor comparisons rather than inflating rates by a flat percentage.
RevPAR and Its Importance in Resort Modelling
Revenue per Available Room combines ARR and occupancy into one measure of room inventory productivity:
- RevPAR = ARR × Occupancy Rate, or equivalently, Room Revenue ÷ Available Room Nights
For example, ARR of ₹8,000 at 50% occupancy yields RevPAR of ₹4,000. In the Indian premium segment, recent RevPAR numbers range from ₹5,000 to ₹10,000 depending on market. Tracking expected RevPAR year-wise in DPRs helps demonstrate how the resort matures and supports strategic decisions on pricing strategies.
Food & Beverage Revenue Model
Food and beverage revenue is generated through on-site dining and bars. In many Indian resorts, F&B revenue can represent around 25% of total revenue, though in destination-oriented resort properties it can reach 35–40%. F&B revenue per occupied room increased by 3.8% in 2025, while luxury resorts saw an 8.7% increase in F&B revenue in 2025. Food revenue in hotel venues increased by 5.2% in 2025, and F&B department profit margins increased from 28.7% to 29.1% in 2025.
Estimation approaches:
- Number of covers × average spend per cover (by meal period)
- Percentage of in-house guests taking meals × average F&B spend per occupied room
Resorts increasingly collaborate with celebrity chefs to boost F&B revenue. Resorts often adopt hybrid models combining all-inclusive and a la carte offerings, where hybrid models offer basic inclusives while upselling premium options. Complimentary breakfast included in packages must not be double-counted as separate food revenue. While this article focuses on revenue, beverage cost and food cost structures matter – high-margin beverage sales and beverage operations can materially affect overall profitability when beverage services are well designed.

Resort Banquet, Wedding & MICE Revenue
A well-designed banquet hall, lawn and event spaces can significantly boost a resort’s economics. Event hosting can fill entire properties, maximizing occupancy and revenue. Events, weddings, and conferences yield substantial revenue through bundled services.
Typical events include destination weddings, sangeet functions, corporate offsites, conferences and family gatherings. Revenue components span venue rental, per-plate F&B billing, bar sales, audio-visual charges, décor coordination and accommodation packages.
Annual Banquet Revenue = Number of Events × Average Revenue per Event
For example, 20 events at an average billing of ₹15 lakh yields ₹3 crore annually. Assumptions must align with banquet rooms capacity, available room inventory for group demand from outstation guests, and seasonal demand. Projecting many large events in off-season months without confirmed visibility from wedding planners or corporate clients weakens credibility.
Destination Wedding Revenue Model
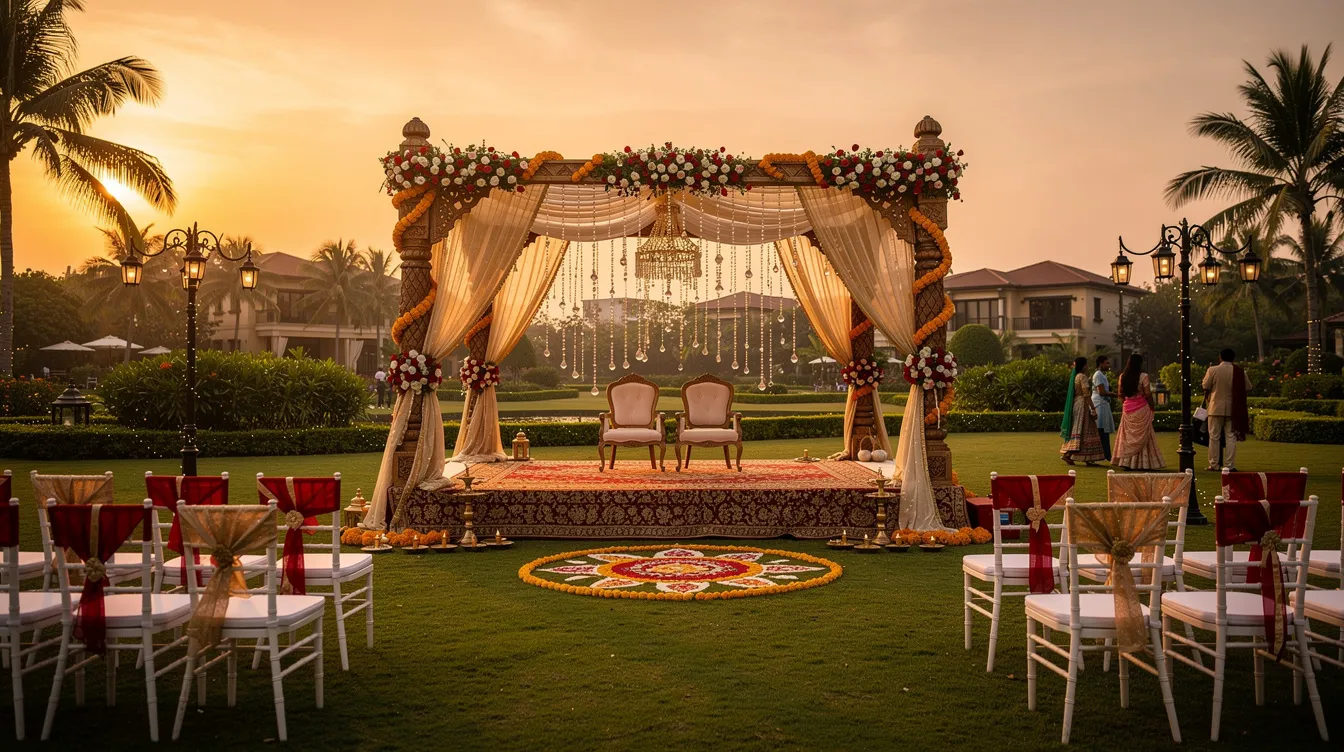
Certain resorts in Rajasthan, Goa, Uttarakhand and coastal regions function primarily as destination wedding venues. A typical 2-day wedding can combine room block revenue (50+ rooms for 2–3 nights), lawn and banquet rental, food and beverage packages, bar sales and curated activities like mehendi functions and farewell brunches. While destination weddings can sharply improve occupancy and ARR during selected dates, DPR assumptions should not rely on an unrealistically high number of such events annually. Data from wedding planners and existing destination wedding resorts should support projections.
Resort Recreation, Activities and Spa/Wellness Revenue
Fees for recreation and activities enhance a resort’s income streams. Common chargeable activities include adventure sports, boating, ATV rides, guided treks, cycling and cultural shows. Revenue is modelled as: Number of participants per day × average activity charge, differentiated between resident guests and walk-ins.
Spa operations include treatments and wellness packages that command premium pricing. Revenue depends on treatment rooms, utilisable hours, slot occupancy and average revenue per treatment. In wellness-focused resorts, spa revenue can be a major contributor, changing the mix of resort revenue streams compared to mainstream leisure properties. Guest preferences for wellness experiences are increasingly shaping the hospitality industry.
Other Income Sources of a Resort
Ancillary income lines look small individually but collectively enhance total revenue and guest experience. Realistic sources include laundry, paid early check-in and late check-out, airport transfers, sightseeing packages, equipment rentals, souvenir shop and day-use packages. Retail and merchandise sales can include local crafts and resort-branded products. Transportation and ancillary services can collectively increase total revenue per guest. Private residences within resorts generate upfront capital or recurring fees in some models.
Avoid overloading the model with dozens of minor heads just to inflate projected turnover – focus on items genuinely feasible for the location and market. These typically appear under “Other Operating Income” in operating statements.
Seasonal Revenue Pattern and Its Impact on Projections
Ignoring seasonality is one of the fastest ways to weaken a resort revenue forecast. Indian resorts have distinct peak, shoulder seasons and off-season periods. Below is an illustrative (not benchmark) monthly pattern for a sample North India hill resort:
| Season | Months | Illustrative Occupancy | Illustrative ARR |
|---|---|---|---|
| Peak | Oct–Dec, Mar–May | 65–75% | ₹10,000–₹12,000 |
| Shoulder | Jan–Feb, Jun | 40–55% | ₹7,500–₹8,500 |
| Off-season | Jul–Sep | 20–35% | ₹5,000–₹6,500 |
Revenue management uses seasonal intelligence: raising ARR on high-demand weekends, offering packages in low season and targeting different guest segments to smooth revenue. DPR projections should explicitly reflect these patterns and help identify trends rather than averaging into one annual figure.
Illustrative Resort Revenue Projection (Year 1 Snapshot)
Illustrative Example – Not an Industry Benchmark. A hypothetical 60-room resort near a popular Indian tourist destination:
| Revenue Head | Key Assumptions | Annual Estimate (₹ Crore) |
|---|---|---|
| Room Revenue | 60 rooms, 360 days, 45% occupancy, ARR ₹8,000 | 7.39 |
| F&B Revenue | In-house meals + walk-in covers + bar | 4.50 |
| Banquet / Events | 20 events, avg. ₹15 lakh per event | 3.00 |
| Spa / Wellness | 2 treatment rooms, moderate utilisation | 0.80 |
| Recreation | Treks, boating, ATV, cultural shows | 0.60 |
| Other Income | Laundry, transfers, retail, day-use | 0.50 |
| Total Revenue | 16.79 |
Conservative assumptions still generate a viable topline when the property is well conceptualised with realistic revenue streams across departments.
Year-Wise Resort Revenue Projection for DPR (Ramp-Up Model)
Resort project reports typically include 5–7 years of projections. Occupancy ramps from a lower level in Year 1 to a stabilised level by Year 3–4, with ARR increasing due to brand recognition and inflation.
| Year | Occupancy | ARR (₹) | Total Revenue (₹ Cr) |
|---|---|---|---|
| Year 1 | 45% | 8,000 | 16.79 |
| Year 2 | 55% | 8,600 | 21.50 |
| Year 3 | 63% | 9,200 | 26.00 |
| Year 4 | 68% | 9,800 | 29.50 |
| Year 5 | 72% | 10,400 | 32.80 |
Revenue growth must align with capacity constraints – a 60-room property cannot cross a theoretical maximum determined by available room nights and realistic ARR. F&B, banquet and other departments should show growth tied to operational drivers rather than arbitrary flat increases. Sustainable growth comes from building reputation, optimizing revenue across departments and expanding service quality.
Revenue Assumptions Banks Examine in a Resort DPR
In my experience, lenders review room inventory, projected occupancy, ARR, seasonal pattern, F&B assumptions, banquet and event volumes, other income logic and year-wise ramp-up. Bankers informally benchmark projections against similar hotels in the region and question numbers that look unusually aggressive. They expect clarity on how revenue assumptions connect to physical facilities – room mix, restaurant capacity, banquet hall size and recreation infrastructure. Operating profit margins fell by 1.1 percentage points in 2024 across the resort sector, making lenders more cautious about revenue and expense categories. Promoters should have supporting documents: market study, competitor tariff analysis, tentative tie-ups with travel agents or corporates.
Common Mistakes in Resort Revenue Projections
- Assuming near-100% occupancy or stabilised occupancy from Year 1
- Using advertised rack rates as realised ARR without accounting for discounts, OTA commissions and service charges
- Ignoring seasonality – flat occupancy and ARR across 12 months
- Overestimating banquet events or assuming large weddings in off-season
- Double counting revenue from package meals (counted in both room revenue and restaurant covers)
- Assuming every amenity (gym, library, games room) generates separate revenue
- Projecting straight-line double-digit growth without operational justification
- Revenue assumptions inconsistent with physical capacity of rooms or banquet hall
Each error overstates revenue, inflates DSCR and damages credibility with lenders. Corrective approaches include phased ramp-up, competitor-validated ARR, moderate event projections and cross-checking with capacity. Promoters should have their revenue model reviewed by a hospitality-experienced consultant before submission – otherwise they miss opportunities to strengthen the proposal.
Linking Revenue Model with Resort Setup, Equipment and Project Cost
Revenue potential is directly connected to resort capacity and facilities. Before finalising revenue assumptions, promoters should understand how room inventory, cottages and amenities affect the overall resort setup cost in India – rooms, cottages & amenities and long-term earning potential.
Quality of equipment, furniture and FF&E – kitchen equipment, banquet audio-visual systems, spa fittings – influences pricing power and guest satisfaction. Promoters can refer to the detailed resort equipment, furniture & FF&E list with cost to plan assets across operating areas.
Once earning capacity is estimated, it should be aligned with the resort project cost & means of finance, including promoter contribution and proposed bank term loan.
How Revenue Model Flows Into Resort Financial Projections
The logical sequence in professional DPRs: Revenue Assumptions → Department-wise Operating Revenue → Operating Expenses → EBITDA → Interest & Depreciation → PAT → Cash Flow. The revenue model drives key financial indicators – DSCR, payback, IRR and break-even occupancy – used by lenders for decision-making. Any change in key assumptions (a 5% drop in occupancy or ARR) should be tested through sensitivity analysis. A separate article on resort financial projections will complete this picture. Operational efficiency across departments directly determines how much of the revenue translates to cash flow and performance.
Practical Approach to Preparing Resort Revenue Assumptions
A step-by-step framework for promoters and consultants:
- Define capacity – rooms by type, restaurant covers, banquet hall seats, spa treatment rooms
- Identify customer segments – leisure, corporate, wedding, wellness guests and their booking windows
- Study competition – competitor tariffs, occupancy data, marketing strategies, guest behavior patterns
- Build occupancy assumptions – month-wise, with weekday-weekend split, reflecting seasonality
- Determine achievable ARR – bottom-up from competitor analysis and target positioning
- Calculate room revenue – using the formula demonstrated earlier
- Estimate F&B demand – from occupied rooms, walk-in covers and beverage sales
- Evaluate banquet potential – realistic event count tied to local demand and capacity
- Identify genuine ancillary revenue – only services physically available at the property
- Prepare year-wise projections – with ramp-up, and run sensitivity checks on occupancy and ARR
Document every major assumption so any banker can trace how the resort revenue projection was constructed.
Resort Revenue Model for Bank Loan DPR
For a bankable DPR, the resort revenue model must be transparent, well-documented and consistent with technical details presented elsewhere in the report. It supports projected P&L, cash flow, balance sheet and ratios like DSCR and break-even point. Banks check whether projected revenue adequately covers operations, interest and instalments. Membership and timeshare models ensure predictable cash flow in some hospitality business formats. No professional can guarantee future performance or loan approval – the role of a good CA is to prepare realistic, defendable projections. Serious resort promoters should consider a professionally prepared resort project report for bank loan rather than oversimplified spreadsheets.
Professional Perspective from CA Manish Gugliya
In my experience preparing resort project reports across different Indian states, the best resort revenue model is not the one projecting the highest turnover. It is the one whose assumptions can be logically explained, cross-checked with market reality and defended in front of lenders.
Promoters often spend months on land, architecture and interiors but only a few days on revenue planning. This creates gaps when bankers ask detailed questions about occupancy, ARR, food revenue and banquet utilisation. I encourage promoters to treat the revenue model as the “business engine” of the resort – linking guest experience, pricing, marketing and financial viability into one consistent framework using a holistic approach.
ProjectReportBank.com is designed as a resource for serious promoters seeking structured guidance on DPR preparation and resort financial modelling in India.
Frequently Asked Questions
What are the main revenue sources of a resort in India?
Primary sources include room revenue, food and beverage revenue (restaurants, bars, room service), banquet and event income (weddings, MICE), recreation and spa/wellness services, and ancillary income like laundry, transfers and activities. The sales mix depends on the resort’s positioning, location and target market.
How is resort room revenue typically calculated in a DPR?
Room revenue = Number of Rooms × Operating Days × Occupancy Rate × ARR. This is usually shown month-wise or year-wise for at least 5 years in financial projections, accounting for seasonal variation in both occupancy and room rates.
Can F&B and banquet revenue exceed room revenue in a resort?
In certain concepts – such as heavy destination-wedding resorts or major MICE properties – combined F&B and banquet revenue can equal or exceed room revenue. The DPR should reflect the specific hospitality business model rather than generic percentage splits.
How do banks verify whether resort revenue assumptions are realistic?
Lenders cross-check projections against local market data, competitor performance, capacity limits (available room nights, banquet size) and their own experience with similar projects. They may request clarifications during appraisal or TEV study and compare projected RevPAR with regional benchmarks.
How many years of revenue projections do banks normally expect?
Most Indian banks prefer 5–7 years of projected financials with clearer detail in the first 5 years, covering revenue ramp-up, stabilised performance and ability to service term loans over the repayment period.
Continue Exploring Our Resort Project Finance Guides
Continue with our detailed Resort DPR resources for project planning, investment estimation, financial analysis, feasibility and bank loan appraisal.
Conclusion
A modern resort should be viewed as a combination of multiple revenue engines – rooms, food and beverage, banquets and weddings, recreation, wellness and ancillary income – not merely as a lodging facility. The relative importance of these streams depends on the resort concept, location and target market. Many resorts that optimise across all departments achieve more revenue and stronger overall profitability than those focused solely on room sales.
A robust resort revenue model, built on realistic occupancy, ARR, F&B and event assumptions and aligned with resort capacity, is essential for any serious resort project report for bank finance in India. Conservative, transparent and logically supported assumptions make the DPR more useful for both promoters and lenders – and ultimately support the unique challenges of building a successful hospitality venture.